
Ole Miss enters 2026 in one of the most interesting financial positions in college football. APSM currently places the Rebels inside an estimated $34 million – $37 million open-market roster-value range, with a current working midpoint of ~$35.5 million.
Approximately 63% of that value is tied to retained players, 33% to portal additions and 4% to incoming recruits.
Under APSM’s separate standardized $1 million tax-only benchmark, Mississippi produces a Net Retention Score of 59/100.
The numbers become more interesting when you consider how Ole Miss got here. The Rebels came off one of the most successful seasons in program history, winning 13 games and reaching the CFP semifinal, only to watch Lane Kiffin leave Oxford for LSU immediately afterward.
Ole Miss promoted defensive coordinator Pete Golding, retained several of its most valuable players and entered 2026 trying to prove that the roster’s value was bigger than the coach who helped build it.
Kiffin’s exit also carried its own financial subplot.
His LSU contract preserved postseason incentives he would have earned had he remained at Ole Miss, meaning the Rebels’ CFP run continued benefiting him financially after he left.
Ole Miss reaching the semifinal ultimately triggered a $500,000 payment, while the clause would have reached $1 million had the Rebels won the national championship.
That makes the 2026 roster more than a collection of expensive players. It is a case study in whether a program can preserve financial and competitive value through one of the largest coaching transitions in the sport.
By mid-November, that transition has become a much harder sell on the field. Georgia handed Ole Miss a lopsided loss in Oxford, and the Rebels followed it by dropping a road game at Oklahoma. At 6-4 and No. 25 in the committee’s latest poll, this is no longer simply a story about replacing Kiffin and retaining expensive players. It is about whether Pete Golding can turn a roster that still carries significant market value into the production Ole Miss expected when it kept that talent in Oxford.
APSM estimates the players themselves at a current $34 million – $37 million market range. That does not represent every dollar Ole Miss raises, spends or allocates to football.
Direct school revenue sharing represents one compensation channel. Legitimate third-party NIL, licensing, appearances and national brand partnerships can create another. Coaching salaries, recruiting, facilities, travel, medical support, and administration are operating costs.
Those figures interact. They are not interchangeable.
Ole Miss did not simply replace Kiffin and start over. The Rebels retained stars such as Trinidad Chambliss and Kewan Lacy, while adding one of the nation’s strongest transfer classes around Golding’s first full season as head coach. The result is a roster built around two expensive decisions: pay to retain proven production and selectively spend to replace what left.
For the athletes, market value is only the starting point.
Gross earning power still has to survive federal taxes, Mississippi income tax, applicable employment or self-employment taxes, representation costs and individual financial decisions before it becomes usable capital.
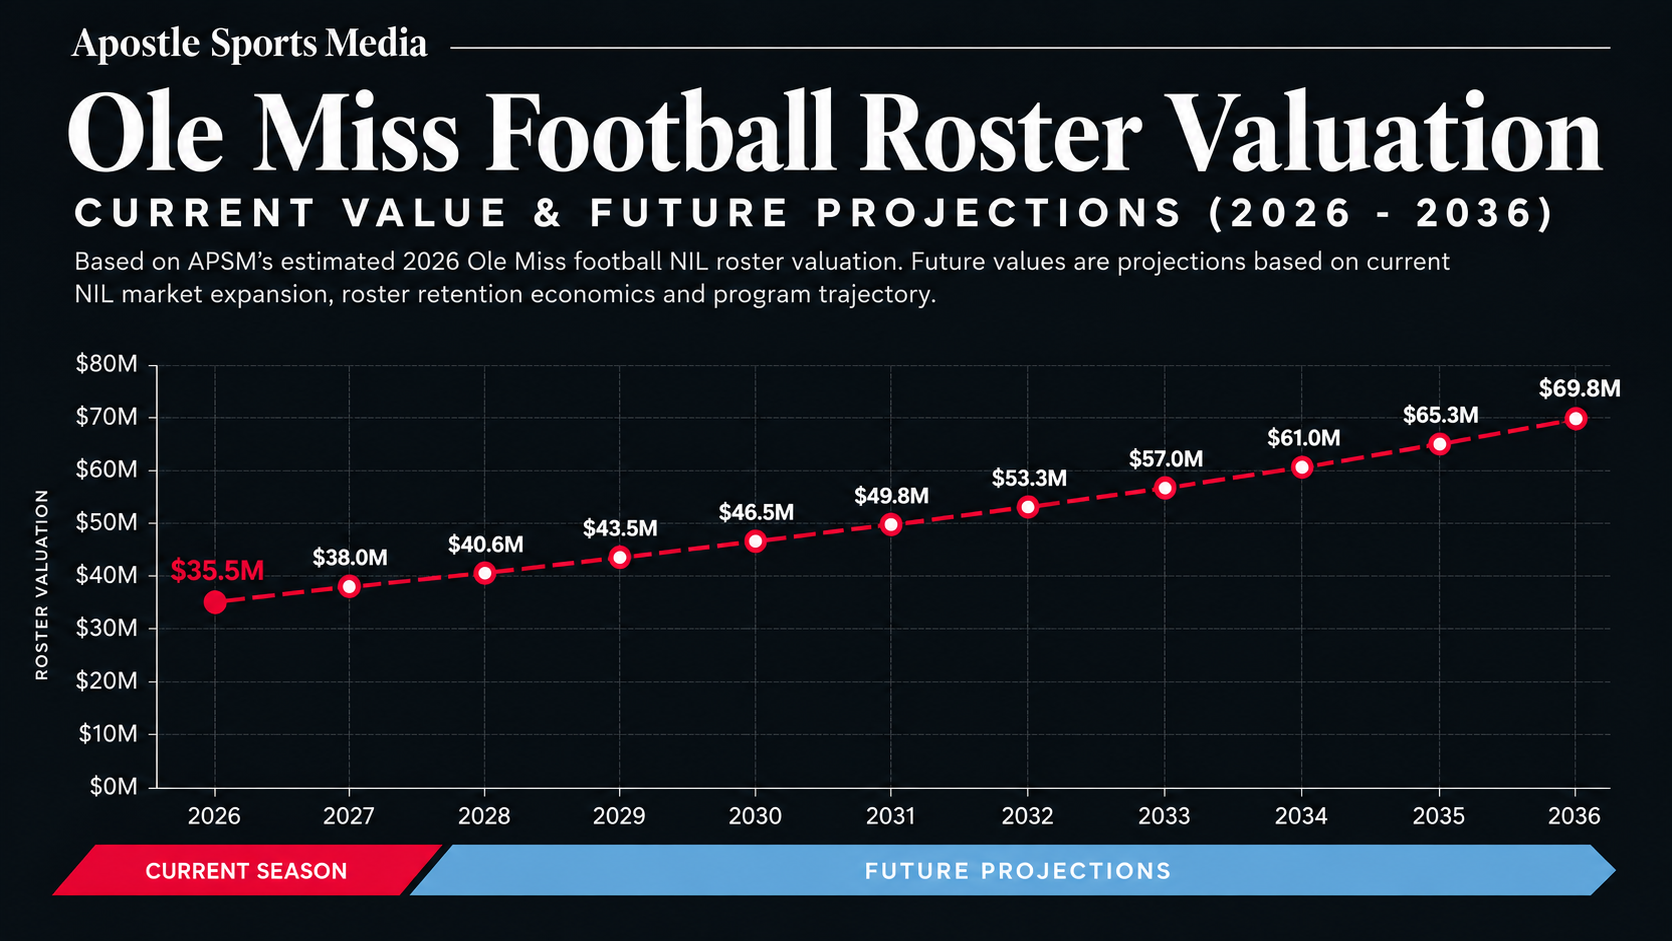
The first APSM projection below begins with the current ~$35.5 million midpoint inside Ole Miss’ $34 million – $37 million 2026 roster range and applies the same illustrative 7% annual market-growth assumption used throughout the CFB roster series.
It is not a prediction of an exact future payroll. It shows what continued NIL expansion, direct revenue sharing and elite-player demand could do to the economic value of Ole Miss’ roster over the next decade.
APSM’s current midpoint model breaks the roster into three primary acquisition buckets:
- Retained players: ~$22.3 million | 63%
- Portal additions: ~$11.6 million | 33%
- 2026 recruits: ~$1.6 million | 4%
The distribution proves that Ole Miss is not rebuilding entirely through the transfer portal, despite the large number of newcomers on the roster. The retained core carries the majority of the estimated market value, led by Chambliss and Lacy.
Ole Miss spent heavily in the portal, but the majority of the roster’s estimated value is still attached to players already inside the program.
Approximately $22.3 million, or 63% of the current valuation, comes from retained players. Portal additions account for another $11.6 million, while incoming recruits represent approximately $1.6 million.
That matters because the transfer portal turned player retention into a financial decision. Developing a star is no longer enough. A program also has to keep that athlete from becoming somebody else’s asset.
Ole Miss itself described its 2026 roster as an infusion of talent after returning 49 letterwinners from the 2025 team. The Rebels finished with the nation’s No. 2 transfer class, alongside a high-school recruiting class ranked in the Top 25.
The financial structure of the Ole Miss roster is a highly optimized combination of retention capital and targeted acquisition capital.
Ole Miss’ five highest-valued players carry approximately $11.9 million in combined estimated market value, equal to roughly 33.5% of APSM’s current ~$35.5 million midpoint.
The concentration is unusual because it combines a massive quarterback position with meaningful value at running back, edge and offensive tackle.
Chambliss alone represents nearly 17% of the roster midpoint, while Ole Miss also carries several additional seven-figure players outside the top five.
| Player | Pos. | Est. 2026 NIL Value | Share of Midpoint |
|---|---|---|---|
| Trinidad Chambliss | QB | $6,000,000 | 16.9% |
| Kewan Lacy | RB | $2,000,000 | 5.6% |
| Suntarine Perkins | EDGE | $1,400,000 | 3.9% |
| Kam Franklin | EDGE | $1,300,000 | 3.7% |
| Tommy Kinsler IV | OT | $1,200,000 | 3.4% |
Trinidad Chambliss is the undisputed financial centerpiece of the Ole Miss roster at an estimated ~$6 million open-market player value for 2026, representing one of the largest increases in college-football player value.
Arriving at Ole Miss from Ferris State (a Division II program), Chambliss seized the starting quarterback role during the 2025 season. He started the final 13 games, throwing for 3,937 yards and 22 touchdowns against just three interceptions, adding 527 rushing yards and eight rushing scores.
His performance turned a player who began his career entirely outside the FBS ecosystem into one of the most valuable assets in the sport. Chambliss’ commercial value has expanded alongside his production.
Ole Miss constructed a national marketing campaign around Chambliss and Lacy (the H6I5MEN campaign), buying digital billboard placements in Times Square and on the Las Vegas Sphere. Furthermore, the pair signed lucrative NIL agreements with Nike during the summer of 2026.
Chambliss’ ~$6 million valuation for the 2026-27 CFB season sits within a much broader commercial portfolio. The exact value of his individual sponsorship contracts is private, meaning those agreements should not simply be added to his roster valuation as guaranteed earnings.
They do, however, explicitly demonstrate how elite athletic performance generates commercial value completely separated from a university’s direct compensation structure.
Kewan Lacy carries an estimated value of ~$2 million, establishing him as the second-highest-valued player on the roster. Lacy enters 2026 following one of the most dominant rushing seasons in Ole Miss history.
He produced 1,567 rushing yards and 24 touchdowns in 2025, shattering program records and earning first-team All-American recognition.
Like Chambliss, Lacy is a central component of Ole Miss’ national commercial strategy. Featured across major U.S. media markets and backed by a Nike NIL relationship, Lacy’s valuation proves the continued financial premium attached to elite running backs when offensive production reaches historic thresholds.

At approximately $1.4 million, Suntarine Perkins is the highest-valued defensive player on the roster.
His valuation underscores the premium placed on edge defenders. These athletes occupy one of the most economically critical positions on any football field because the ability to disrupt the opposing quarterback is a rare, game-altering trait.
Ole Miss’ defensive value extends beyond Perkins, with Kam Franklin and Will Echoles also carrying seven-figure valuations.
Carrying an estimated valuation of ~$1.3 million, Kam Franklin gives Ole Miss a tandem of seven-figure+ edge defenders anchoring its financial structure.
That defensive concentration also fits Ole Miss’ transition from Lane Kiffin to Pete Golding. Arriving at Ole Miss in 2023 as defensive coordinator, Golding built much of his national reputation around defensive architecture and pass-rush development, and the current roster places meaningful market value into positions closely aligned with that expertise.

Tommy Kinsler IV completes the top five at approximately $1.2 million. His valuation helps protect the two most valuable pieces of the offense.
Ole Miss holds approximately $8 million of estimated value between Chambliss and Lacy alone. Protecting the quarterback and maintaining the attack is therefore a massive component of protecting that core capital.
The roster’s investment in Kinsler reflects the foundational financial principle of college football: premium skill-position spending requires equally aggressive investments along the line of scrimmage.
The current House settlement structure allows participating Division I schools to provide direct financial benefits to athletes.
For 2026–27, the available schoolwide benefits and revenue-sharing pool is approximately $21.58 million per participating institution.
That number should not be stacked directly on top of Ole Miss’ $34 million – $37 million roster-value range and described as a fictional football payroll.
They measure different things.
- $34 million–$37 million is APSM’s current estimate of Ole Miss football’s open-market player-value range.
- ~$35.5 million is APSM’s current working midpoint.
- ~$21.58 million is a schoolwide institutional revenue-sharing ceiling across participating sports.
Legitimate third-party NIL exists separately from both.
The accounting distinction matters because a school can spend enormous amounts around athlete compensation without every dollar representing guaranteed football-player income.
Meanwhile the benefits pool establishes the hard cap on what a participating school can distribute through the direct-compensation framework. Actual earnings depend on individual agreements, and outside third-party NIL provides an entirely separate layer of compensation.
| Financial Measure | 2026 Figure |
|---|---|
| APSM estimated CFB roster market value | ~$35.5M |
| 2026–27 benefits/revenue-sharing cap | ~$21.58M |
These are different financial measurements and should not be added together into a fictional ~$57.1 million “football payroll.”
The broader NIL ecosystem is now substantial enough that direct institutional payments represent only one component of an athlete’s potential earnings.
The College Sports Commission cleared more than $227 million in NIL deals during July and August 2026 alone, including approximately $188.6 million involving associated entities.
Ole Miss has aggressively tapped into this environment to elevate its highest-profile athletes. By placing Chambliss and Lacy in Times Square and on the Las Vegas Sphere, Ole Miss deliberately expanded the athletes’ national visibility beyond the football field.
More exposure creates larger audiences.
Larger audiences create more commercial inventory.
That can make an athlete more attractive to brands even when the sponsorship revenue itself is separate from the roster valuation.
A national advertising campaign increases awareness; awareness scales audience; audience dictates sponsorship demand; and sponsorship demand directly increases third-party NIL income.
To support a roster of this magnitude, an institution requires a massive operational foundation. Ole Miss reported approximately $178.6 million in total operating revenue during fiscal 2025, including $90.74 million attributed exclusively to football.
The football program generated approximately $21.83 million in ticket sales and received approximately $15.27 million in conference distributions. The athletic department nevertheless reported an operating deficit of approximately $5.15 million for the fiscal year because total expenses reached $183.77 million. This distinction is vital for financial literacy.
Large athletic revenue does not mean the department has an equivalent amount of liquid cash available for athlete distribution. Operating costs -coaching salaries, support staff, facility debt service, travel, and guarantees – consume enormous resources.
The public financials show the massive scale of the business, but they are not a simple profit-and-loss calculation for player spending.
Ole Miss raising $107.9 million does not mean $107.9 million became athlete compensation. The university itself says the money supports multiple institutional purposes, which is exactly why total program funding should not be confused with roster value.
Following Lane Kiffin’s departure to LSU in November 2025, Pete Golding became Ole Miss’ 40th head football coach. His five-year agreement raised his compensation from roughly $2.61 million as defensive coordinator to approximately $6.8 million in his first season as head coach.
That money does not belong inside Ole Miss’ $34 million–$37 million roster-value range.
It does provide useful organizational context. Ole Miss is paying nearly $7 million annually for the executive responsible for recruiting, retaining, developing and deploying a player portfolio centered around a ~$35.5 million current midpoint.
The Rebels’ 32–24 win over Kiffin’s LSU made that comparison even more interesting. One game does not prove the return on Ole Miss’ investment, but beating the former coach who helped construct much of the underlying roster gave Golding an early competitive result against the program that hired Kiffin away. Pasted text
Using the same standardized 2026 framework APSM applies to other coaching contracts, Golding’s salary also provides a useful gross-to-net example.
If his full ~$6.8 million annual compensation were modeled as W-2 income for a single filer, APSM estimates roughly $3.9 million could remain after federal income tax, employee Social Security and Medicare taxes and Mississippi state income tax, before incentives, itemized deductions, benefits, retirement contributions or individualized planning.
That represents roughly 57% of gross compensation under the standardized illustration.
A $6.8 million coaching contract and a $6.8 million bank balance are two very different numbers.
APSM estimate only: Golding’s actual filing status, deductions, benefits, contract structure and tax return are private. The example illustrates the financial mechanics of a coaching contract rather than estimating his private tax liability.
Mississippi gives high-income athletes a relatively favorable state-income-tax environment. For tax year 2026, the first $10,000 of Mississippi taxable income is exempt, while taxable income above that threshold is subject to a 4% state rate.
But that does not mean an Ole Miss athlete simply loses 4% and keeps the other 96%. Federal income tax remains the largest component for seven-figure earners, while employment or self-employment taxes can apply depending on the compensation structure.
Representation costs (agent fees) also reduce usable income; paid NIL activity performed in jurisdictions outside an athlete’s resident state can also create additional state filing obligations.
The easiest way to understand Mississippi’s advantage is therefore to keep the athlete’s income constant and change only the tax environment.
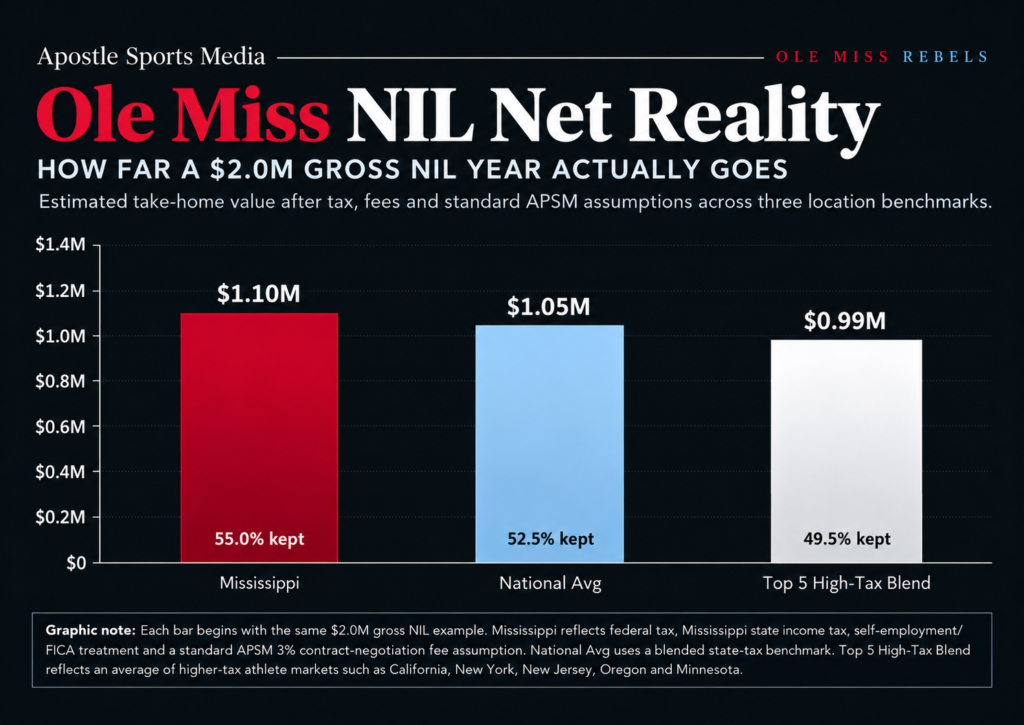
Using the APSM Net Income Calculator, a $2 million gross NIL example with a 3% representation estimate, 0% personalized expenses and Mississippi as the primary jurisdiction models approximately $1.10 million of retained capital, or roughly 55% of gross.
The same gross figure will not produce the same result for every athlete. Income structure, filing status, deductions, residency and multistate activity can materially change the final number.
Mississippi’s relatively favorable income-tax environment does not mean every part of the state’s tax system is equally light.
The state generally imposes a 7% sales tax, with an average combined state-and-local rate of roughly 7.06%.
For an athlete earning seven figures, sales tax will never have the same impact on retained capital as federal or state income tax, but it still affects how quickly lifestyle spending consumes the money that remains after taxes.
That distinction matters because income tax affects what an athlete keeps before spending, while sales tax affects what happens when that retained capital is actually consumed.
A player who earns $2 million and immediately increases spending on vehicles, clothing, electronics, restaurants and other taxable purchases can lose additional capital through consumption even after the major income-tax bill has already been paid.
Sales tax does not change an athlete’s NIL valuation. It changes the cost of using the money once it becomes theirs.
Property taxes become more important once an athlete converts income into real estate. Mississippi’s statewide effective property-tax rate on owner-occupied housing is approximately 0.58%, although actual bills vary by county, municipality, assessed value and available exemptions.
At that statewide effective rate, a hypothetical $1 million property would represent ~$5,800 per year in property tax before accounting for differences.
That is substantially different from the headline purchase price.
An athlete who buys a home outright still owns an asset with recurring costs attached to it: property tax, insurance, maintenance, utilities and potentially association fees. Paying off the mortgage removes the loan payment; it does not eliminate the carrying cost of the property.
For Ole Miss athletes considering ownership in Oxford, that distinction belongs in the same Net Reality conversation as income taxes. The purchase price is only the beginning of the real-estate equation.
Mississippi is generally considered a lower-cost state, but Oxford itself should not be treated as bargain-basement real estate simply because it sits in Mississippi.
As of August 2026, Zillow placed the average Oxford home value at approximately $416,262, up about 3.3% year-over-year. Average rent was approximately $2,061 per month.
For comparison, Zillow’s national typical home value was roughly $368,697 during the same period, meaning Oxford housing actually carries a premium relative to the national benchmark.
That creates an interesting financial environment for Ole Miss athletes.
The state income-tax burden is comparatively modest at 4%, property taxes are relatively low nationally, but housing around the university is not necessarily cheap.
For a seven-figure athlete, that can still create substantial flexibility.
A player retaining more than $1 million from a high-income season has the ability to rent comfortably, purchase a primary residence, or consider an investment property without automatically committing several million dollars to housing.
That is the broader APSM point: location affects wealth through more than one tax rate.
- Income tax determines part of what the athlete keeps.
- Sales tax affects consumption.
- Property tax affects ownership.
Housing prices determine how much capital must be committed to the asset in the first place.
For more information on state-by-state athlete tax drag impact: read –> State Income Tax Explained for NIL & Professional Athletes
Because player agreements, tax returns and representation contracts are private, APSM cannot determine the exact take-home income of Ole Miss players from market valuations alone.
The standardized APSM roster model therefore uses the same core framework across schools:
- 2026 progressive federal income-tax brackets
- applicable employment or self-employment/FICA treatment
- the athlete’s primary-state income-tax structure
- a 3% contract-negotiation / representation estimate
- 0% invented personalized expenses
That last assumption is intentional.
One player might spend $40,000 operating his NIL business. Another might spend $250,000 across training, travel, housing, family support and lifestyle.
Those individualized expenses belong inside the APSM Net Income Calculator, where the user can actually change them, rather than inside a roster article where APSM would have to invent them.
At the standardized $2 million Mississippi benchmark, the current model retains approximately 55% of gross value.
Because taxation is progressive and athlete income can be structured differently, the 55% figure should be understood as a standardized comparison benchmark rather than a prediction of any player’s actual retention rate. For consistency within this illustration, APSM applies that benchmark to the rounded player values below.
Ole Miss’ five highest-valued players carry approximately $11.90 million in rounded combined market value. Under the standardized player model, that corresponds to roughly $6.55 million in illustrative retained capital.
Those figures are not reported salaries or predictions of anyone’s private tax return. They show the financial bridge between headline player value and the capital potentially available to save, invest or deploy elsewhere.
| Player | Gross Valuation | Illustrative Deductions | Illustrative Net Capital |
|---|---|---|---|
| Trinidad Chambliss | $6,000,000 | ~$2,700,000 | ~$3,300,000 |
| Kewan Lacy | $2,000,000 | ~$900,000 | ~$1,100,000 |
| Suntarine Perkins | $1,400,000 | ~$630,000 | ~$770,000 |
| Kam Franklin | $1,300,000 | ~$585,000 | ~$715,000 |
| Tommy Kinsler IV | $1,200,000 | ~$540,000 | ~$660,000 |
Using the standardized model above, Chambliss’ ~$6 million valuation corresponds to approximately $3.3 million in illustrative retained capital.
That does not mean APSM is recommending how he should use it. The point is to show what becomes financially possible once gross earning power is converted into retained capital.
Diversified Investments
The athlete still needs liquidity for housing, family, training, taxes and ordinary life. But investing only 20% of that modeled net income would put approximately $660,000 into productive assets immediately.
At an illustrative 8% annual return, with no additional contributions, that single investment could grow to approximately $1.42 million over 10 years and roughly $3.08 million over 20 years.
That is the financial advantage of earning meaningful capital young: time can do a substantial amount of the work.
Oxford Real Estate
With roughly $3.3 million in modeled retained capital, real estate becomes another allocation rather than an all-or-nothing purchase decision.
Oxford’s roughly $416,000 average home value means a seven-figure athlete could potentially purchase substantial equity outright or use a smaller portion of retained capital toward a primary residence or investment property while preserving liquidity elsewhere.
Rather than maximizing borrowing capacity, a highly liquid athlete could acquire a primary residence with massive equity, or utilize the capital as a substantial down payment on a multifamily investment property. Oxford’s 3.3% recent annual appreciation rate serves as a useful benchmark for evaluating property as a long-term capital preservation vehicle.
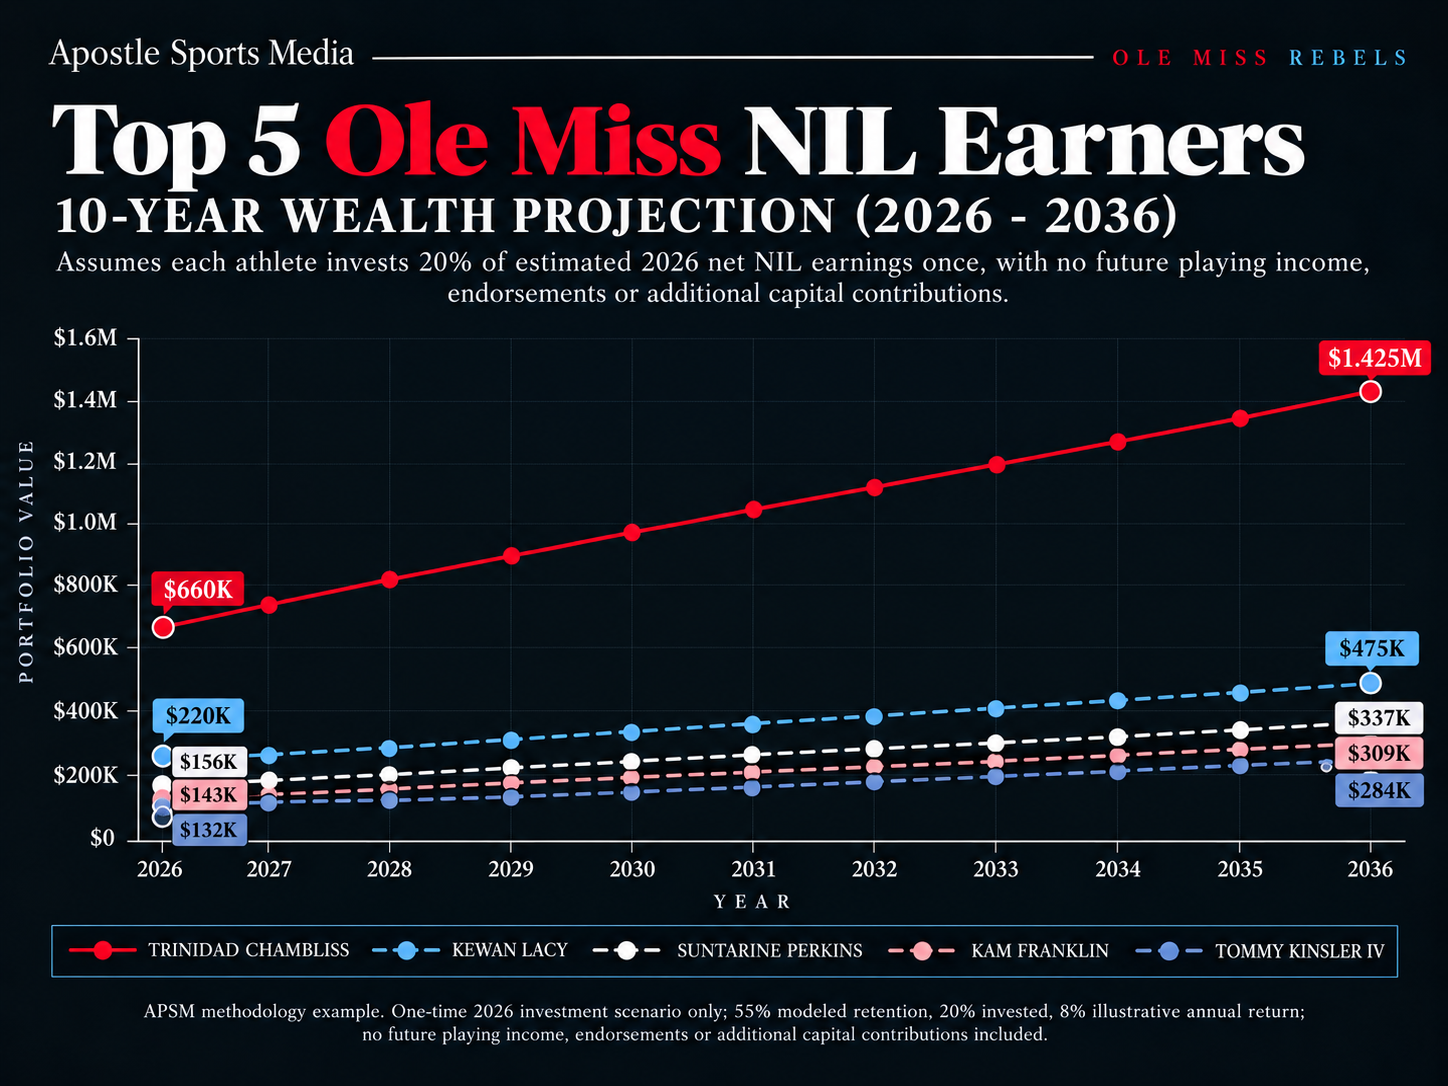
The cleanest way to isolate the financial value of Ole Miss’ earning window is to eliminate future football income entirely. For this illustration, assume 2026 is the only football/NIL earning year included in the model.
No future Ole Miss NIL payments.
No endorsement growth.
No NFL contract.
No additional investment contributions.
Each athlete invests 20% of his modeled 2026 retained capital once, then leaves the original investment compounding at an illustrative 8% annual return through 2036 (ROI).
That creates starting investments of roughly:
- Chambliss: ~$660,000
- Lacy: ~$220,000
- Perkins: ~$154,000
- Franklin: ~$143,000
- Kinsler: ~$132,000
The point is not to predict their future net worth. It is to measure how much financial momentum one college earning window can create before a professional contract ever enters the equation.
Why This Data Matters
The point of this projection is not to predict these five athletes’ future net worth. It is to isolate what one college earning window can accomplish if only 20% of modeled retained capital is invested and no additional football income is ever added.
If an NFL contract eventually follows, that professional income can become additional capital rather than the beginning of wealth creation.
And if professional football never comes, the underlying lesson is even more important: temporary athletic income can still become permanent productive capital.
Ole Miss’ broader financial position becomes easier to compare once the player-specific Net Reality calculations are separated from APSM’s standardized Net Retention Score.
Under the benchmark, every jurisdiction begins with the same $1 million of gross athlete income.
Agent fees and personalized career expenses are removed so the score isolates the underlying tax environment rather than the athlete’s individual representation or spending decisions.
For Mississippi, that produces an APSM Net Retention Score of 59/100.
APSM Net Retention Score: Mississippi — 59/100
That score should not be confused with the roughly 55% retention modeled at the standardized $2 million Ole Miss player example.
The player model uses a different gross-income level and includes the 3% representation assumption. The Net Retention Score fixes gross income at $1 million and removes representation and personalized expenses so Mississippi can be compared directly with Texas, Alabama, California, Florida, Georgia or any other jurisdiction under the same tax-only framework.
Mississippi’s 4% individual income-tax rate creates more drag than a no-income-tax state such as Texas, but still gives Ole Miss athletes a relatively competitive state-level starting point compared with several higher-tax jurisdictions.
The score does not mean every Ole Miss athlete literally keeps 59 cents of every dollar. It is the standardized state-level benchmark underneath the broader Net Reality calculation.

APSM FINANCIAL REPORT · $9.99
The Million-Dollar Illusion
A million dollars earned is not a million dollars kept. Explore the taxes, fees and financial decisions behind the headline.
36-page research report · Two fillable worksheets included
The $35.5 million roster is structurally supported by a drastically larger institutional financial ecosystem. Ole Miss football generated $90.7 million in operating revenue during fiscal 2025. The university raised a record $107.9 million through athletics fundraising during 2025–26, designated for scholarships, capital projects, and revenue sharing.
The program turned its stars into national marketing entities via Nike and the Las Vegas Sphere, and simultaneously absorbed the $6.8 million Year-1 contract for Pete Golding as head coach following Lane Kiffin’s exit. These are not one singular pool of money; they are distinct, heavily managed components of an increasingly professionalized sports enterprise.
For Athletes
Mississippi’s 59/100 APSM Net Retention Score gives Ole Miss athletes a relatively competitive tax-only starting position, but gross value still has to survive federal taxes, income structure, representation and individual financial decisions before it becomes lasting capital.
A ~$6 million player valuation creates extraordinary opportunity. It does not automatically create a ~$6 million balance sheet.
For Agents
Roughly one-third of Ole Miss’ roster midpoint is tied to portal acquisitions.
That makes evaluating proven college talent, negotiating retention and transfer leverage, structuring commercial opportunities and understanding the athlete’s eventual net position increasingly important parts of representation.
For Sponsors
Ole Miss’ Times Square, Las Vegas Sphere and Nike activity demonstrates the commercial advantage of partnering with athletes whose university is actively expanding their national exposure.
Athletic performance creates the audience. Institutional marketing can amplify it. The athlete’s individual brand ultimately determines how that attention is monetized.
For Ole Miss
Ole Miss’ challenge is capital allocation: fund schoolwide revenue sharing, retain proven players, acquire portal talent, recruit high-school athletes, compensate an expensive coaching staff and operate the larger athletic enterprise without pretending every dollar belongs in the same accounting bucket.
The early win over Kiffin’s LSU made the story better. The Rebels changed coaches without immediately destroying the roster value or competitive product built around the prior regime.
Ole Miss currently sits inside APSM’s estimated $34 million–$37 million 2026 football roster-value range, with the current player-level dataset centered around a ~$35.5 million working midpoint.
Approximately 63% of that value is tied to retained players, 33% to portal additions and 4% to recruits.
That construction tells the story of modern Ole Miss football.
The Rebels did not simply buy an entirely new team after Lane Kiffin left. They spent to protect a valuable retained core, aggressively replaced missing production through the portal and handed that portfolio to Pete Golding, whose first-year head-coaching compensation is approximately $6.8 million.
Then Ole Miss beat Kiffin’s LSU.
Around the roster sits a much larger enterprise: a roughly $21.58 million schoolwide revenue-sharing environment, more than $90 million in annual football operating revenue, record athletics fundraising and a third-party NIL ecosystem capable of placing Rebel athletes with Nike and across national advertising campaigns. Pasted text
Those numbers do not belong to one financial bucket.
For the athletes, Mississippi also produces an APSM Net Retention Score of 59/100 under the standardized $1 million tax-only benchmark.
That is the starting point.
A ~$6 million player valuation is not ~$6 million of wealth.
Gross has to become income.
Income has to survive taxes and fees.
Retained capital has to survive lifestyle.
Whatever remains then has to become savings, investments, business equity, real estate or another productive asset before temporary earning power can become lasting financial security.
That is the Net Reality.
APSM currently places Ole Miss’ 2026 football roster inside an estimated $34 million – $37 million open-market range, with a current working midpoint of approximately $35.5 million. The range reflects the fact that player values can move with production, injuries, role changes, portal leverage and commercial demand.
Ole Miss’ five highest-valued players carry approximately $11.9 million in combined estimated market value, equal to roughly 33.5% of APSM’s current ~$35.5 million working midpoint.
- Trinidad Chambliss (QB): ~$6.0M
- Kewan Lacy (RB): ~$2.0M
- Suntarine Perkins (EDGE): ~$1.4M
- Kam Franklin (EDGE): ~$1.3M
- Tommy Kinsler IV (OT): ~$1.2M
Chambliss alone accounts for roughly 17% of the midpoint, making quarterback the clear financial centerpiece while meaningful value remains distributed across running back, edge and offensive tackle.
No. The $34 million–$37 million range represents APSM’s estimate of Ole Miss football’s open-market player value, not a disclosed university payroll.
Direct institutional revenue sharing, legitimate third-party NIL agreements, sponsorship income and broader football operating expenses are separate financial categories.
Using APSM’s standardized 2026 framework with progressive federal taxation, applicable employment or self-employment/FICA treatment, Mississippi’s state-income-tax structure, a 3% representation estimate and 0% personalized expenses, the $2 million benchmark models approximately $1.10 million of retained capital, or roughly 55% of gross.
Actual results can vary materially based on income structure, filing status, deductions, residency and individual circumstances.
Mississippi exempts the first $10,000 of taxable income and applies a 4% individual income-tax rate above that threshold in 2026.
High-income Ole Miss athletes can still owe federal income tax, applicable employment or self-employment taxes and potentially taxes to other jurisdictions when income is earned elsewhere.
Under APSM’s standardized $1 million tax-only benchmark, Mississippi produces a Net Retention Score of 59/100.
- Georgia Million 2026 CFB Roster Valuation: Net Reality
- Alabama 2026 CFB Roster Valuation: Net Reality
- Ohio State 2026 CFB Roster Valuation: Net Reality
- Lane Kiffin Could Earn $1 Million Off Ole Miss’s CFP Run After Leaving for LSU – Inside the Head Coach Postseason Bonus Structure
- Mississippi Athlete Taxes
Sources & Methodology
APSM’s Ole Miss roster valuation is an independent analytical estimate based on published roster information, reported athlete-market evidence and APSM’s player-level financial modeling.
APSM treats third-party valuations as inputs, not verified compensation or a disclosed university payroll.
- Roster documentation: The official 2026 roster establishes program and player context, not the price of every private NIL agreement.
- Independent sports-market context: CFP rankings helps contextualize the player market and college-football environment; the valuation judgments remain APSM’s.
APSM valuation and Net Reality methodology: APSM keeps estimated player market value, institutional operating expenditure, reported compensation and after-tax retained capital separate. All financial midpoints, player allocation shares, tax assumptions, retention benchmarks and investment scenarios already in this article remain unchanged. For APSM’s standard method, see the Net Income Calculator and Net Reality methodology.
Disclaimer: This article contains general financial information for educational purposes and does not constitute professional advice. APSM estimates are derived from publicly available information, tax assumptions, finance modeling, and industry-standard fee structures. Actual earnings may vary based on residency elections, private contract provisions, image/media rights agreements, bonuses, and tax filings.