

NHL players are often viewed as the “underpaid” siblings in professional sports when compared to NBA, MLB, and even NFL stars.
But the story isn’t just about raw salary numbers. How players get paid, how much they actually take home, and why these figures fluctuate so dramatically is one of the most intricate financial and tax puzzles in professional sports.
NHL salaries are a web of guaranteed contracts, escrow deductions, multi-jurisdictional taxes, currency risk, and revenue-sharing rules that no other league has to navigate.
For NHL players, take-home pay isn’t just a matter of talent or contract size, it’s influenced heavily by where they play, where they live, when they get bonuses, and even how the Canadian dollar performs against the U.S.
The NHL Pay Structure
Unlike NFL contracts, which are mostly non-guaranteed, NHL deals are fully guaranteed.
Every player on the roster is assured the salary in their contract will be paid, even if injuries, buyouts, or poor team performance occur. Paychecks are distributed bi-weekly across the seven-month season (October–April), but there are a few quirks that make NHL cash flow unique:
1. Signing Bonuses
Every July 1, players can receive negotiated signing bonuses regardless of games played, injuries, or whether they’ve been traded.
These bonuses are a powerful tool for agents to maximize net income, especially if the player maintains residency in a low-tax state like Florida or Texas.
2. Escrow Withholding
The NHL is the only major North American sports league with mandatory escrow.
Each contract includes a percentage of pay withheld to ensure that players and owners achieve a 50/50 split of Hockey Related Revenue (HRR) as outlined in the CBA.
Escrow levels have fluctuated over the years:
- 2018–19: ~9.5%
- Pandemic seasons: 17–20%
- 2023–24: ~6–8% (projected)
- Long-term steady-state: ~6%
For a $6 million per year player, an 8% escrow year results in ~$480,000 withheld before taxes, fees and expenses. Escrow is returned only if league revenues exceed projections, meaning players effectively share financial risk with team owners.
No other major league distributes revenue in this way, and it’s a key factor when evaluating take-home pay versus contract headline value.
Canadian vs U.S. Teams Can Determine Millions
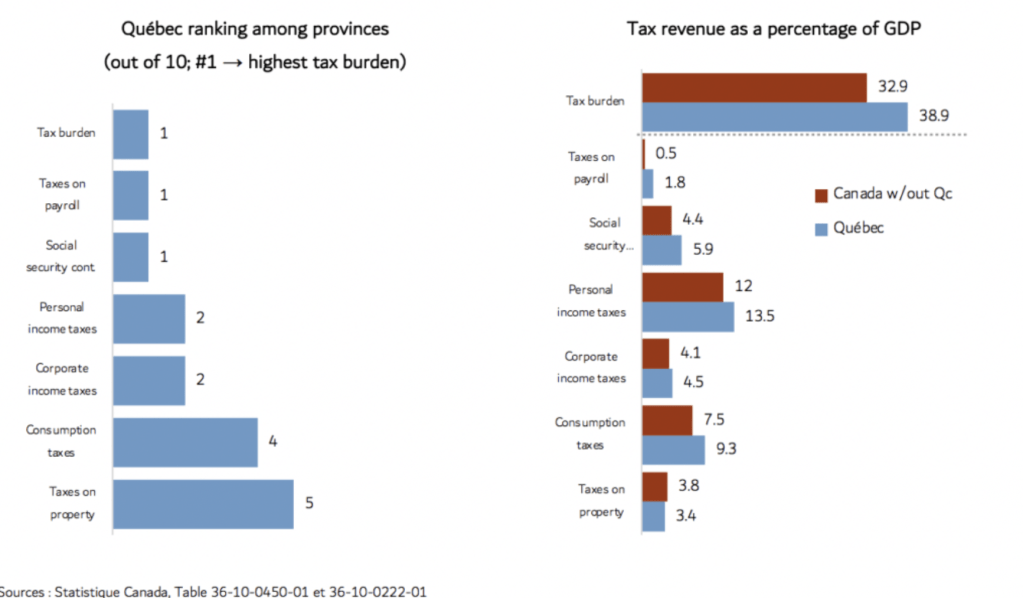
NHL players face a rare challenge: the league spans two countries with wildly different tax systems, and for Canadian teams, the burden can be punishing. The top combined federal + provincial marginal tax rates where NHL teams reside often exceed 50%.
Quebec and Ontario are the harshest:
- Quebec: 53.3%
- Ontario: 53.5%
- B.C.: 53.0%
- Alberta: 48%
Escrow is taken after gross salary, meaning players can lose over half of their contract before pocketing or spending a single dollar.
U.S. “No-Tax” States means state income tax is 0%. When combined with federal deductions, a player grossing $8 million in annual earnings in Tampa can take home ~$1–$1.4 million more than the same contract in Toronto, Canada or Los Angeles, California.
This discrepancy has been labeled the “tax premium”, and it forces Canadian teams to offer higher gross salaries just to remain competitive on net pay. For a top free agent, this difference can make or break a decision on where to sign.
Jock Taxes, FX Exposure, and Multi-Jurisdiction Complexity
On top of base salary and escrow, NHL players navigate jock taxes, multi-currency exposure, and international payroll risk:
- Jock taxes: Players pay tax in every state/province where games occur. A Toronto-based player might file 10+ separate returns annually.
- Currency exposure: NHL caps are set in USD, but Canadian teams earn a significant portion of revenue in CAD, while salaries are paid in USD. A weakening Canadian dollar increases payroll costs for Canadian clubs.
- Residency planning: Players can establish tax residency in a low-tax U.S. state to reduce liability on signing bonuses and offseason income.
No other major league combines these multi-jurisdictional, multi-currency, and revenue-share complexities. It’s why NHL take-home pay is often more important than headline salary numbers.
Comparing NHL Salaries to Other Leagues
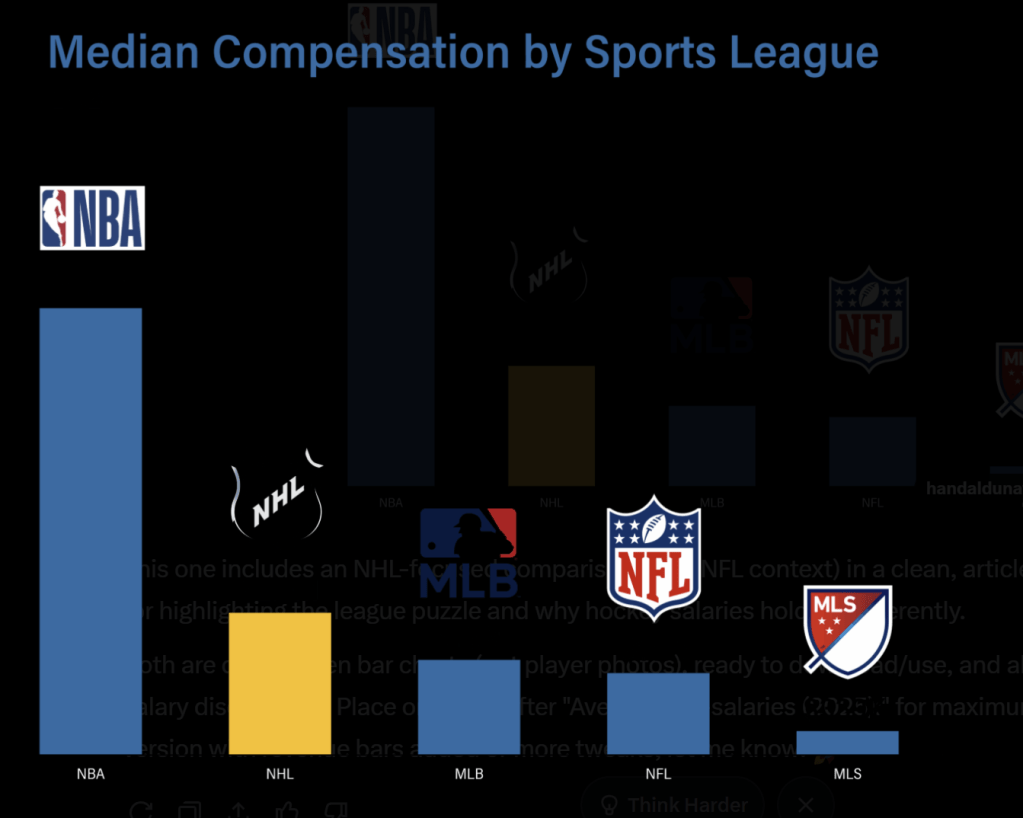
Average pro-salaries (2025):
- NBA: ~$10.3 million
- MLB: ~$4.9 million
- NHL: ~$3.6 million
- NFL: ~$3.1 million
At first glance, NHL players earn less than NBA stars and comparable MLB players, but context is everything.
In terms of league revenue and structure, the NBA generated approximately $12.5 billion in 2024.
With an average roster of 15 players, the league operates under a hard salary cap with a luxury tax system, and nearly all contracts are fully guaranteed. The short rosters and max-contract structure drive higher average salaries per player.
MLB, meanwhile, brought in roughly $12.1 billion in revenue with larger rosters averaging 26 players.
There is no formal salary cap, though luxury tax thresholds exist, and contracts are fully guaranteed.
The longer 162-game season increases per-diem and operational costs but also spreads revenue across more players, which impacts AAV.
The NFL dwarfs other leagues in total revenue, generating about $21 billion in 2024, with rosters averaging 53 players.
While the league maintains a hard salary cap, contracts are only partially guaranteed, and the combination of a short career window and high injury risk creates a unique earnings landscape.
The NHL operates with smaller revenues than other U.S. pro-leagues, generating ~$6.4 billion in 2024, and an average roster of 23 players.
The league uses a hard salary cap combined with a 50/50 Hockey Related Revenue split between players and owners. Contracts are fully guaranteed, but escrow deductions and the relatively smaller revenue pool reduce take-home pay compared to other major leagues.
NHL revenues are roughly 1/3 of NBA/MLB, but the average roster size is larger than NBA, shrinking average player salary.
Add in escrow and taxation, and the net gap is even wider.
Signing Bonuses as a Strategic Tax Tool
Because bonuses are paid on July 1, tax residency determines the net impact. Players living in Florida, Texas, or Nevada can save millions in federal and state taxes, and structuring bonuses outside the regular season can bypass escrow withholding entirely.
Example
A $10 million signing bonus to a Florida resident is only subject to federal tax (~37%).
No escrow is withheld if structured properly, potentially adding $500K–$800K to net income relative to Canadian counterparts.
These strategies explain why stars migrate to U.S. no-tax teams and why Canadian clubs must stretch to compete financially.
Free Agency Landscape & Financial Competition
Taxes aren’t just a player issue, they influence league competitiveness:
- Canadian teams often have to overpay to retain talent.
- No-tax states retain stars easier.
- Escrow amplifies net pay differences, creating larger financial incentives for players to leave high-tax provinces.
- Currency swings can further depress Canadian contract values in USD terms.
Agents model every dollar net-of-tax, meaning headline salary isn’t always what drives decisions.
A star moving from Toronto to Tampa Bay can increase take-home pay by $1+ million per season, making tax arbitrage a tangible career lever.
Short-, Medium-, and Long-Term Outlook
Short-term: Escrow moderates, cap rises slightly, Canadian teams still face FX and tax penalties. Player mobility favors low-tax U.S. markets.
Medium-term: NHL digital and international rights expansion could increase revenues for Canadian franchises, reducing net pay penalties. Cap inflation slowly increases average salaries.
Long-term: Salary parity with NBA/MLB depends entirely on media revenue growth. Without a TV rights boost, the NHL will structurally remain a smaller league with complex net-pay dynamics, where location, tax, and escrow outweigh headline earnings.
Gross vs Net in the NHL
For fans, NHL salary numbers are often headline-grabbing but misleading. Players compete in net dollars, navigating:
- Escrow deductions
- Multi-jurisdiction taxes
- Jock tax filings
- Currency exposure (CAD/USD)
- Provincial/state tax premiums
- CBA revenue-share adjustments
For top players, residency, contract timing, and team location can mean millions of dollars in take-home difference, a decision far more consequential than lifestyle alone.
In short, NHL salaries are big on paper, but even bigger on the financial strategy behind the scenes.
Enjoy Reading How Money Works In Sports?
The APSM $100 Million Pro Contract Report Includes:
- Contract structure analysis
- Federal and stat taxes, agent fees, and escrow modeling
- Sponsorships, endorsement and bonus impact scenarios
- Investment & wealth retention and long-term strategies
- Real-world case studies of player earnings vs take-home
Everything you need to understand how multi-million dollar contracts translate into actual wealth and how to avoid common financial pitfalls in pro sports. Buy the report today and see the truth hidden behind the curtain of money in sports.
Next Reads
- Escrow
- Why NHL Players Flock to Florida Teams: Taxes & Take-Home Pay
- Top 5 Longest NHL Contracts In History
- The Streaming Problem in Sports
- How UFC Promotion Drives Revenue
Credits
Written By: Aidan Anderson
Research & Analysis: Apostle Sports Media LLC
Sources: CapFriendly, NHL salary structure & escrow mechanics 2025, Spotrac, IRS & Canadian tax tables, Forbes, APSM Proprietary Analysis
Featured Image: Public Domain / Grok Image Creation
Disclaimer: This article contains general financial information for
I will sing to the Lord all my life;
I will sing praise to my God as long as I live.
– Psalm 104:33