
Washington came into the 2025-26 college football season with a roster valuation of around $21 million, but as player payment figures have shifted from reported estimates toward confirmed agreements, and the season approaches its final stretch, APSM now places the Huskies’ roster value at approximately $23 million – $26 million as of November.
APSM uses a working midpoint of roughly $24.4 million, based on its player-level valuation methodology, Net Retention modeling framework and broader NIL market assumptions.
The Huskies have endured a difficult first two seasons as members of the Big Ten. Despite still ranking among the top 40 rosters in estimated value, Washington has struggled to recapture its identity since Kalen DeBoer left for Alabama following the heartbreaking loss to Michigan in the 2023–24 CFP National Championship.
Demond Williams Jr. was supposed to reignite the program after Michael Penix Jr. departed for the NFL. Instead, Williams found himself at the center of one of college football’s most significant university-player contract disputes, before ultimately remaining with Washington under an NIL and revenue-sharing package reportedly worth roughly $4.5 million for the 2026 season.
Williams has been sidelined since suffering a fractured rib against Iowa in Week 6, and Washington has once again struggled to reach its potential, failing to appear in the AP Top 25 at any point during 2026.
Despite the on-field struggles, the university announced a 10-year partnership with Columbia Bank on November 12 that will rename Husky Stadium “Columbia Bank Stadium,” beginning January 1, 2027, with the agreement running through the 2037 season.
The agreement is reportedly worth $70 million over ten years, carrying an average commercial value of roughly $7 million annually and marking the largest publicly announced college football stadium naming-rights agreement in NCAA history, according to the University of Washington’s official athletics reporting.
Two days after announcing the record-setting deal, Washington defeated Michigan State 21-14, reaching bowl eligibility at 6-4 under Jedd Fisch and setting up a home meeting with CFP contender Indiana.
While Coach Fisch, Demond Williams Jr. and the program have struggled to produce the on-field development Washington expected, the university’s growing commercial operations help explain the peculiar economics of modern Washington football.
The school is monetizing one of college sports’ most recognizable venues while struggling to compete in a conference where retaining a productive quarterback can require a multimillion-dollar agreement. Its commercial revenue, player market value and actual cash compensation all interact, but they do not belong to the same financial account.
APSM estimates Washington’s 2026 football roster in a $23 million–$26 million open-market player-value range, with a working valuation midpoint of approximately $24.4 million.
Of that midpoint, APSM attributes roughly 76% to retained athletes, 17% to portal additions and 7% to 2026 recruits. Quarterback Williams Jr., at an estimated $4.5 million, represents approximately 18.4% of the entire modeled roster by himself.
The valuation is a player-market estimate, not a disclosed University of Washington football payroll. APSM uses public roster information, reported compensation where credible, multiple outside valuation inputs and its own player-level normalization to arrive at the range.
For athletes, the financial question goes further than what another school might pay to acquire their services.
Washington state does not impose an individual income tax on ordinary NIL earnings in 2026, although federal taxes, applicable employment taxes, representation costs and Seattle’s high cost of living can substantially reduce the capital a player ultimately controls. APSM’s separate standardized $1 million tax-only Washington Net Retention Score is 63/100; that score is not the percentage every Husky player keeps.
In other words, Washington is a retention story, a contract story and a geography story. The roster has a market price. The football program generates business revenue. The athlete still needs to convert earned income into something that lasts.
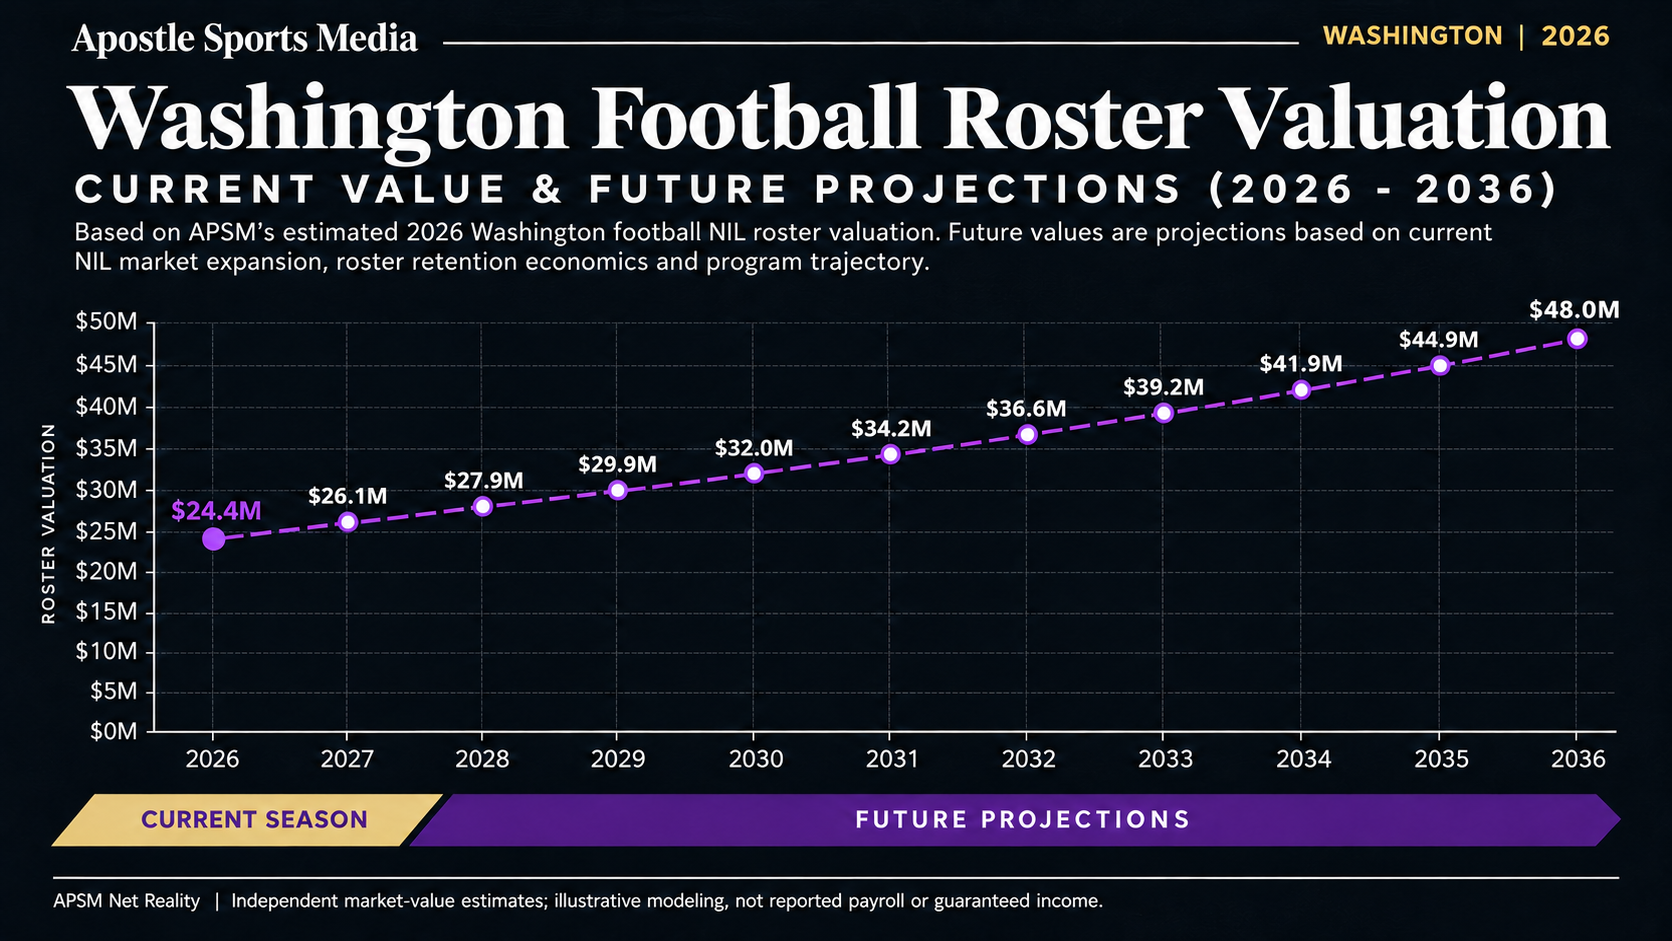
The first APSM projection begins with the current ~$24.4 million working midpoint within the estimated $23 million-$26 million range and applies an illustrative 7% annual growth assumption through 2036.
These are scenarios for the future market value of college players, not estimates of Washington’s future university payroll or contracted spending.
Washington’s $24.4 million roster valuation becomes particularly revealing when looking at how much of that market value belongs to athletes the program has already developed, rather than players acquired through the transfer portal.
According to NCAA Research, approximately 59% of fourth-year FBS football players in its 2025 academic cohort had transferred schools at least once. While that figure does not represent the share of roster spots filled through the portal in a single season, it illustrates how common player movement has become across college football.
Washington has taken a somewhat different approach. At Big Ten Media Days, the conference reported that 58 of Washington’s 101 players were returning athletes, with returning starters at 20 of 22 positions. That represents roughly 57.4% of the roster by headcount, but APSM estimates retained players account for a substantially larger share of its financial value.
Of the Huskies’ $24.4 million working midpoint, APSM attributes approximately $18.5 million, or 76%, to retained talent; $4.1 million, or 17%, to transfer additions; and $1.8 million, or 7%, to 2026 recruits.
Washington does not necessarily retain three-quarters of its players, but roughly three-quarters of its estimated player market value is concentrated in athletes already within the program.
This is not the financial structure of a school rebuilding its entire depth chart through the portal each winter. Instead, it creates a different kind of pressure: every player the coaching staff develops into a more valuable athlete, can become more expensive to retain the following season.
In the transfer portal era, successful recruiting and player development no longer settle the long-term question of whether a school can keep its best talent. They create another negotiation, often at a substantially higher market price than the player commanded when first arriving on campus.
Coach Fisch has publicly emphasized high-school recruiting, internal development and selective portal use, describing a program built around retaining the players it develops. That philosophy makes financial sense when Washington can preserve a meaningful core; while targeting positions where the cost of acquiring a proven transfer is justified.
But a retention-heavy model is only efficient if the agreements required to keep its most valuable players do not consume so much financial flexibility that the rest of the roster becomes difficult to sustain. Outside Washington roster and acquisition estimates provide additional market context, although APSM independently establishes its working valuation and allocation.
Washington’s 2026 season also shows why the “retention model” does not necessarily mean ignoring younger talent. In its November game notes, Washington Athletics reported that five different first-year players had already combined for 37 starts during the season. Those opportunities give the Huskies immediate production from younger athletes whose market values could rise considerably as they gain experience.
And that is where Washington’s approach becomes both an advantage and a financial risk. The program can recruit an athlete at one market price, invest multiple seasons in developing him, and eventually face a retention negotiation based on a much higher valuation. The better the player becomes, the more expensive that continuity can be.
The financial cycle is simple to describe but difficult to execute: recruit athletes, invest in their personal and physical development, reassess their market price as they continue to outperform their metrics, and determine which agreements are worth renewing. Washington’s current roster is built around that sequence, with one unusually expensive quarterback at its center.
The five highest-valued players in APSM’s updated Washington model combine for approximately $8.325 million, representing 34.1% of the Huskies’ $24.4 million working midpoint.
Of that concentration, quarterback Demond Williams Jr. accounts for $4.5 million, or roughly 54% of the top-five total, while an edge defender, two offensive tackles and a wide receiver make up the remaining $3.825 million.
The updated list also reflects how Washington’s player market has shifted since APSM’s July snapshot, with freshman offensive tackle Kodi Greene now entering the top five ahead of Isaiah Ward.
More importantly, the valuations show where Washington’s financial priorities are concentrated: retaining its quarterback, protecting the offensive line and preserving talent at positions where proven production carries a premium.
These are five different player markets,
not five interchangeable NIL personalities.
Washington’s Top Five 2026 Player Valuations
APSM roster market range: ~$23M–$26M | Working midpoint: ~$24.4M
| Player | Pos. | Est. Market Value | Share of Midpoint |
|---|---|---|---|
| Demond Williams Jr. | QB | $4,500,000 | 18.4% |
| Jacob Lane | EDGE | $1,130,000 | 4.6% |
| Drew Azzopardi | OT | $1,110,000 | 4.5% |
| Christian Moss | WR | $835,000 | 3.4% |
| Kodi Greene | OT | $750,000 | 3.1% |
Demond Williams Jr. | ~$4.50 Million | Quarterback
Williams remains the most expensive individual asset in Washington’s football portfolio. In 2025, he started all 13 games and threw for 3,065 yards, 25 touchdowns and eight interceptions, adding 611 rushing yards.
The combination of passing production, mobility, national exposure and the scarcity of established Power Four quarterbacks was likely the primary reason his 2026 value sits so far above Washington’s second-highest individual player NIL income estimate.
Unfortunately for the Huskies, Williams’ 2026 season has not been an uninterrupted upward line of on-field success, and the young man has been unable to give Washington the return on its investment it expected.
Washington considered a quarterback competition with Elijah Brown during October before Williams returned to the starting role, a reminder that a player’s market value can coexist with real performance and playing-time risk.
On November 14, Williams completed 22 of 33 passes for 288 yards and two touchdowns in the win at Michigan State, providing a fresh example of the upside Washington was trying to preserve.
At approximately 18.4% of Washington’s entire modeled roster value, Williams matters beyond his individual stat line. His ability to threaten defenses through the air and on the ground affects the opportunities available to receivers, backs and the offensive line.
The question is not whether $4.5 million of player-market value guarantees a $4.5 million cash payment. It is how much of Washington’s recruiting, retention and commercial strategy depends on one position.

Jacob Lane | ~$1.13 Million | EDGE
Jacob Lane represents a different kind of premium asset in Washington’s football portfolio. While the Huskies have committed their largest individual valuation to their underperforming quarterback, Lane plays the position responsible for disrupting that same investment on opposing teams.
An effective edge defender forces pressure on quarterbacks that leads to rushed decisions, draw additional blockers and limit the production of an offense’s most expensive players. In a conference like the Big Ten, where offensive line play and quarterback protection remain major priorities, that kind of defensive production carries its own market premium.
Lane’s approximately $1.13 million APSM valuation makes him Washington’s highest-valued defensive player in the working model. His position also illustrates why the five most valuable athletes on a roster are not necessarily the five with the largest endorsement portfolios or social-media audiences.
Washington may have stronger commercial reasons to market Williams, but it has equally important football reasons to retain Lane. His value is tied to what he can prevent an opposing offense from producing, not simply the attention he can generate away from the field.
Drew Azzopardi | ~$1.11 Million | Offensive Tackle
Drew Azzopardi carries an estimated $1.11 million in player-market value, making him one of Washington’s most important investments along the offensive line. With ~$4.5 million of the roster’s value concentrated in Demond Williams Jr., keeping its quarterback protected becomes more than a coaching priority. It is also a form of preserving the value Washington has already committed to its offense.
A productive tackle rarely receives national attention like the programs’ quarterback standing behind him, but his performance can directly influence how effectively that quarterback operates.
Washington’s valuation of Azzopardi reflects that relationship, particularly in a conference where protecting the passer can determine whether an offense functions as intended; or, falls short of expectations like the Huskies have.
Azzopardi’s value also extends beyond the field. In May, Washington and Premera Blue Cross included him among six athletes participating in a mental-health-awareness initiative.
The partnership provides a documented example of Washington connecting its athletes with commercial opportunities in the Seattle market, although Azzopardi’s individual compensation was not publicly disclosed.
That distinction is important: a real endorsement opportunity supports an athlete’s value, but it does not mean every dollar of his estimated $1.11 million market valuation has already been earned, paid and received.
Christian Moss | ~$835,000 | Wide Receiver
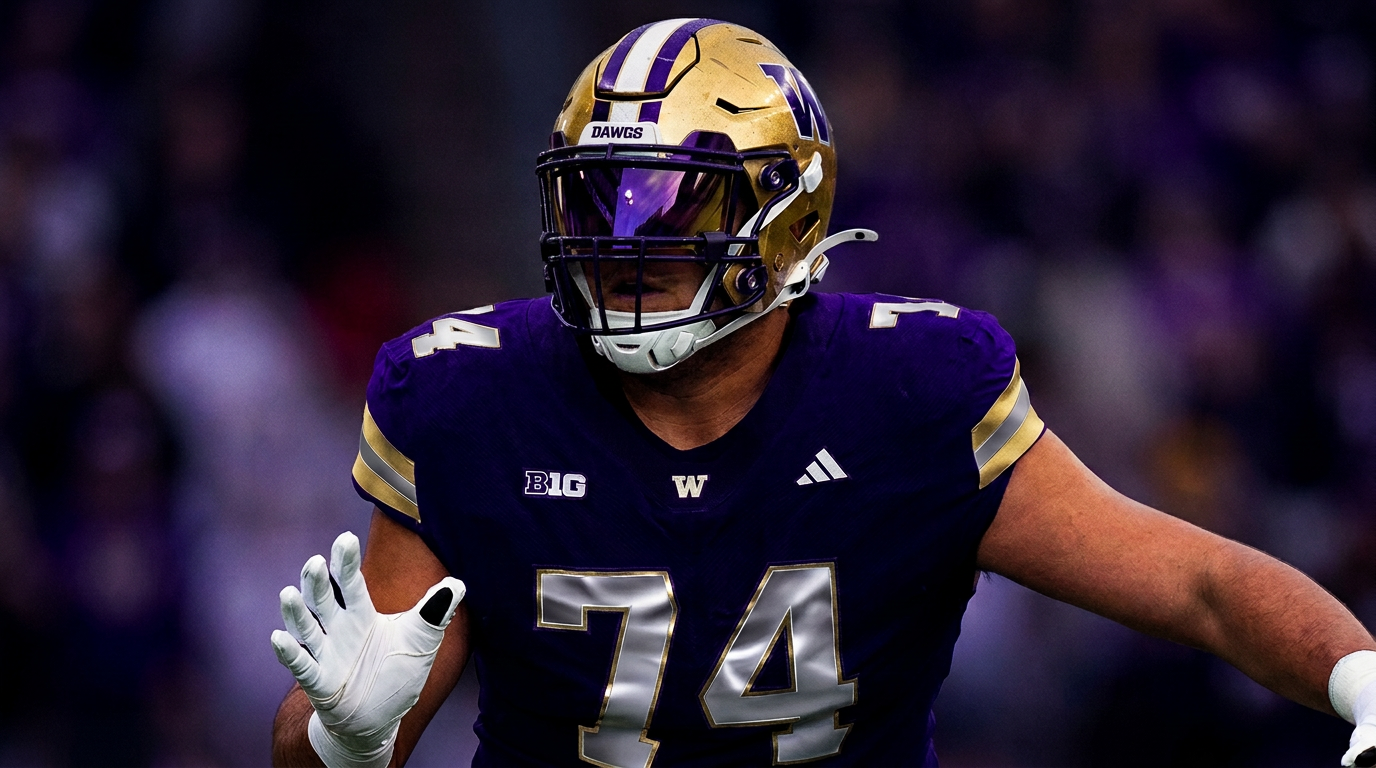
Christian Moss carries approximately $835,000 in estimated player-market value, giving the Huskies another significant offensive investment beyond its quarterback and offensive line.
For a program spending heavily to retain Williams, the receiving corps becomes an important part of making that investment worthwhile. The Huskies can protect their quarterback with elite linemen, but they still need receivers capable of turning those opportunities into completions that lead to points on the scoreboard.
That relationship helps explain Moss’ place among Washington’s five highest-valued players. A productive quarterback can increase a receiver’s national exposure and opportunities for endorsement income, while reliable receivers can improve the quarterback’s performance and overall market value.
The two positions influence one another financially, even though their individual NIL opportunities and compensation arrangements remain separate. Moss’ approximately $835,000 valuation reflects his role in Washington’s offensive structure rather than simply his potential to attract sponsors or generate social-media engagement.
Kodi Greene | ~$750,000 | Offensive Tackle
Freshman Kodi Greene, valued by APSM at approximately $750,000, rounds out Washington’s updated top five and gives the Huskies a second offensive tackle among their most valuable players.
Greene arrived with a recruiting background that already carried significant market value. The former Mater Dei standout, who also played at Eastside Catholic in the Seattle suburbs, entered Washington as a highly regarded offensive line prospect with the physical tools and recruiting pedigree to attract attention before accumulating several seasons of college production.
But unlike some freshmen whose early valuations depend almost entirely on recruiting projections, Greene has already begun establishing his value on the field. By late October, he had started at left tackle, providing early evidence that the university was receiving immediate production from its investment.
Greene is particularly important to Washington’s broader financial strategy because he represents the recruiting side of its retention-heavy roster model.
The Huskies can acquire a talented high-school prospect, develop him internally and potentially avoid paying the higher acquisition price associated with an established transfer.
However, that advantage also creates a future financial obligation. If Greene continues developing into a productive Big Ten offensive tackle, his market value may rise alongside the cost of keeping him in Seattle.
With Azzopardi and Greene combining for approximately $1.86 million in estimated player-market value, Washington has committed a meaningful portion of its roster valuation to protecting its most expensive individual asset. Rather than concentrating every premium dollar at quarterback and the skill positions, the Huskies are also placing value on the infrastructure required to make those investments productive.
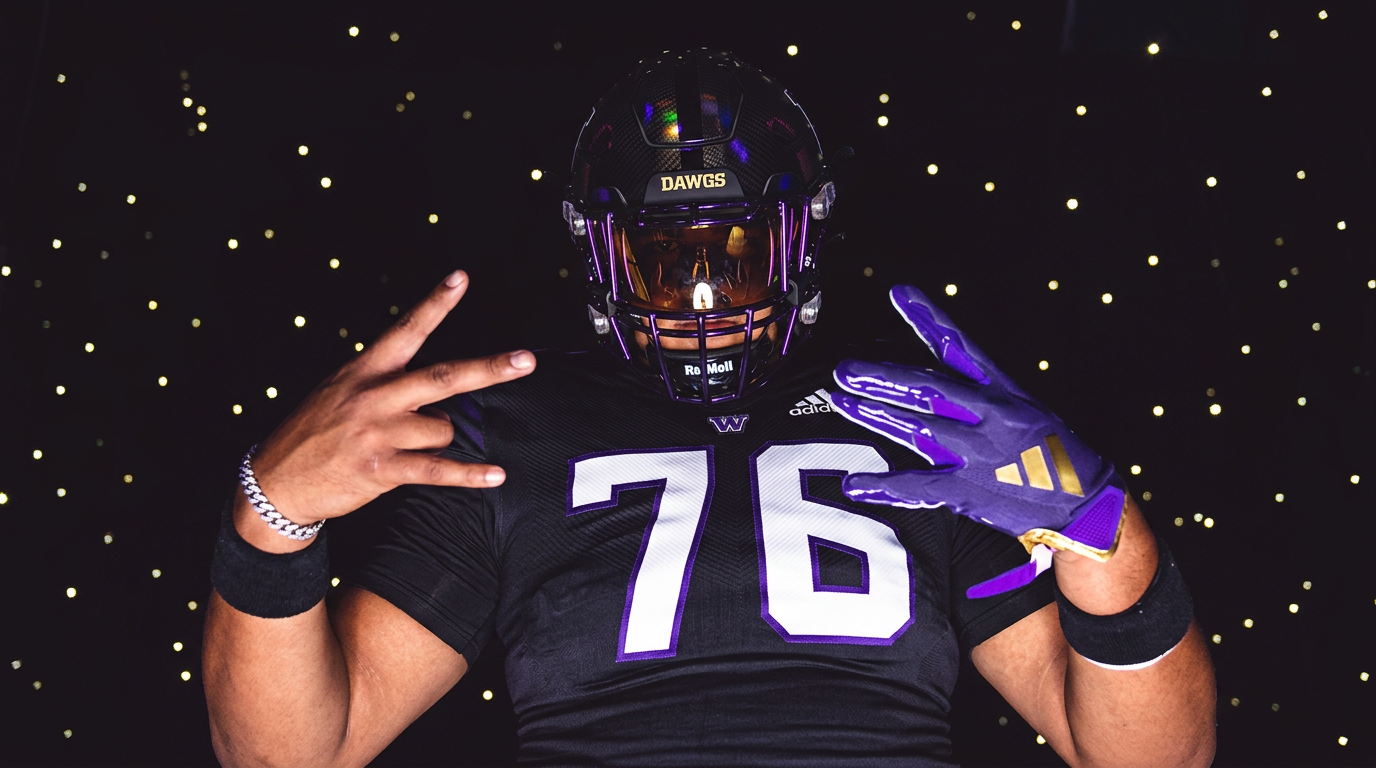
Washington’s concentration in Williams was not merely theoretical.
In January 2026, Reuters reported that the quarterback had reached an agreement reportedly worth $4 million to $4.5 million to remain with the Huskies, only for Williams to announce his intention to enter the transfer portal shortly afterward.
University officials considered protecting their contractual rights, while Williams’ then-agent ended their relationship during the dispute. After several days of uncertainty, SBJ reported that the quarterback was leaning toward returning to Washington, which he ultimately did.
APSM examined the dispute when it happened in College Football Has Entered Its Contract Era: The Financial Fallout of the Demond Williams Jr. Case.
What the Williams dispute showed, is that a program can spend years developing a quarterback into a multimillion-dollar player, but its ability to retain him now depends on contractual terms, the transfer market and the opportunity cost of committing those same dollars elsewhere.
The reported agreement and APSM’s $4.5 million valuation are not necessarily the same financial object. One represents reporting about a particular compensation agreement, while the other is APSM’s modeled assessment of the player’s open-market value.
This does not establish how much Williams received in guaranteed money, whether every dollar was paid in cash, or whether separate NIL and institutional compensation figures should be added together.
The larger development is price discovery under contractual constraints. An athlete gains leverage from the possibility of leaving, while a university that has signed a valid agreement may have enforceable rights depending on its terms and applicable law.
The dispute also demonstrates how agent representation has become increasingly important as college athletes negotiate agreements that can carry significant financial and legal consequences.
For Washington, the challenge remains the same: retain a quarterback capable of elevating its offense without allowing the cost of one position to crowd out the rest of the player portfolio.
The House-settlement framework introduced direct institutional athlete compensation, but it did not turn every published roster valuation into a university payroll statement.
Washington publicly committed to participating in the new system, with athletic director Pat Chun announcing that the university would distribute the maximum allowable revenue share to its athletes.
In its original announcement, Washington estimated approximately $20.5 million in annual schoolwide revenue sharing beginning with the 2025–26 academic year.
For the 2026–27 academic year, the College Sports Commission estimates the schoolwide revenue-sharing cap at approximately $21.3 million, an increase from the settlement’s first year.
This is where the distinction becomes financially important. It would be misleading to add the approximately $21.3 million institutional cap to APSM’s $23 million – $26 million football market-value range and present the combined figure as Washington’s actual football payroll.
The first represents the maximum schoolwide distribution permitted under the settlement framework, while the second estimates what Washington’s football players are worth in the broader market.
Legitimate third-party NIL agreements represent another income category, and broader athletic department operating expenses belong in a separate financial account altogether.
Those figures may influence one another, but they are not interchangeable, nor can they simply be added together to determine what Washington actually pays its football roster.
This separation is especially important for Washington because the university is developing new corporate revenue streams alongside its athlete compensation commitments.
The reported $70 million Columbia Bank stadium agreement expands the commercial value surrounding the program, but it does not mean that revenue automatically becomes additional compensation for Williams or any other individual player.
For Washington, the financial challenge is not simply how much revenue the university can generate, but how effectively it can convert those resources into a competitive roster while managing the limits of institutional spending and the separate market for third-party NIL compensation.
Washington’s football portfolio operates inside an athletic department with substantially larger financial obligations. While APSM estimates the Huskies’ 2026 roster at $24.4 million, the university is responsible for financing an athletic operation that generates and spends nearly $180 million annually.
According to the university’s FY2025 NCAA financial reporting, Washington recorded approximately $178.47 million in departmental revenue against $184.35 million in expenses, resulting in a roughly $5.88 million departmentwide shortfall.
Of those expenses, approximately $80.55 million was attributed specifically to football, demonstrating how much of the university’s athletic spending is concentrated in the program responsible for generating much of its commercial attention. The figures are documented in the Knight-Newhouse financial data and Washington’s NCAA reporting.
However, a separate federal reporting system tells a slightly different financial story. Under the Equity in Athletics Disclosure Act (EADA), Washington reported ~$121.02 million in FY2025 football revenue and $68.92 million in football-specific expenses, alongside approximately $178.42 million in total departmental revenue.
At first glance, those figures suggest a substantial difference between football revenue and expenses. But EADA and NCAA financial disclosures operate under different reporting definitions, meaning the figures cannot simply be mixed or cross-subtracted to produce an accurate football profit calculation.
Washington generates substantial football revenue, but it also maintains major coaching contracts, operating expenses, player-development commitments and a broad varsity-sports portfolio.
The departmentwide funding shortfall further demonstrates that generating revenue does not automatically translate into available capital for additional athlete compensation. And none of those figures represents what Demond Williams Jr. or any other player on the Huskies 2026 roster actually retains after federal and state income taxes, fees and other financial obligations.
The November Columbia Bank Stadium partnership, reportedly worth $70 million over ten years, becomes particularly important against that financial backdrop. The agreement gives Washington a long-term commercial relationship, a new stadium identity beginning in 2027 and additional initiatives involving athlete development, NIL opportunities and education.
In its official partnership announcement, the university even introduced an “NIL to Net Worth” initiative aimed at helping athletes translate short-term earning opportunities into long-term financial well-being.
As universities expand their commercial partnerships and direct athlete compensation programs, financial literacy is increasingly becoming part of the infrastructure surrounding college athletics, rather than something athletes are expected to navigate entirely on their own.
However, the headline does not establish when every dollar will be received, how the proceeds will be allocated across university operations or what portion, if any, will ultimately reach individual athletes.
Washington is no longer just selling tickets and broadcasting football games. It is selling access to one of college sports’ most recognizable brands, the audience surrounding that brand and the commercial opportunities that come with maintaining a competitive Big Ten program.
The roster is necessary to create the product on the field, but the revenue generated around that product must still support the broader athletic enterprise. Washington’s challenge is balancing the growing market price of its players against the financial obligations required to operate everything surrounding them.
Washington does not need to manufacture a corporate ecosystem around its athletes; it operates in Seattle, where major companies already have substantial operations and established brand identities.
Through Dawgs Unleashed and related partnerships, the athletic department has described athlete-marketing relationships involving Alaska Airlines, Boeing, T-Mobile, Starbucks, Blizzard Entertainment and others. The program’s relationship with Learfield adds sales, content and commercial-development infrastructure that can connect athletes with advertisers.
An athlete’s commercial value extends beyond a school’s permitted direct revenue-sharing allocation. Appearances, licensed content, local campaigns, endorsement agreements and influencer work may generate separate payments, provided the relationships satisfy applicable rules.
Those opportunities also create different tax and recordkeeping obligations, particularly when an athlete combines university compensation with independent NIL activity and third-party agreements.
Washington expanded its media-production capabilities in September 2026 with Sundodger Studios, a facility supporting an operation that produces approximately 100 live broadcasts and 120 in-venue video-board shows.
The purpose extends beyond broadcasting football games. High-quality production increases the content inventory available to the department, its sponsors and athletes who have commercial audiences of their own.
The result is a distinctive NIL proposition: Washington can offer the exposure of a Big Ten football program alongside the business-development advantages of a major technology and consumer-brand market.
When Kalen DeBoer left Washington for Alabama following the Huskies’ appearance in the 2023-24 CFP National Championship, Jedd Fisch inherited a program with expectations that extended far beyond reaching bowl eligibility.
Unfortunately for Washington, the results under Fisch have yet to resemble the program that went 14-1 in DeBoer’s final season.
The Huskies finished 6-7 in 2024, improved to 9-4 in 2025, and enters the final stretch of 2026 at 6-4, still searching for the consistency necessary to compete among the Big Ten’s top programs.
While Fisch deserves credit for navigating Washington’s transition into the conference and rebuilding much of its roster, the program’s development back to regular CFP contention has been slower than many expected.
That is particularly difficult to ignore when considering how much the university has invested in both its coaching staff and player market.
Fisch arrived in Seattle on a reported seven-year, $54 million contract, with 2026 annual compensation estimated at approximately $7.7 million, according to Sporting News.
His agreement represents a significant coaching expense for the athletic department, not an asset included within APSM’s estimated $23 million – $26 million football roster value.
Washington is spending heavily on the leadership responsible for managing an increasingly expensive player portfolio, making Fisch’s ability to deliver results more important than ever.
For him to secure his long-term future with the program, he must continue attracting high-school prospects, retaining established athletes and selectively acquiring transfers while competing with the Big Ten’s larger brands and maintaining an on-field product capable of supporting ticketing, media and sponsorship revenue.
Washington has made it clear that it wants to build around the players already in its program rather than chase an entirely new roster through the transfer portal every offseason.
While that approach has helped preserve much of the Huskies’ talent, younger players are still being asked to step into major roles, and the team continues to struggle against the Big Ten’s best.
For Fisch, the challenge is turning that continuity into consistent success and getting Washington back to the standard fans grew accustomed to under DeBoer. The money is there, and so is the talent, but the results have yet to justify what the university is spending to return to the top.
A coach’s gross salary also cannot automatically be modeled as if it were independent NIL self-employment income (Form 1099). Coaching compensation is generally structured through employment agreements, with employee tax treatment, benefits and contract-specific provisions that differ from standardized athlete type NIL-income illustrations.
For that reason, Fisch’s personal after-tax earnings remain outside APSM’s player Net Reality calculations.
His salary is relevant to Washington’s operating costs and financial priorities, but it should not be mixed into the estimated market value or modeled take-home income of the athletes he coaches.
Washington gives many high-income athletes a considerable financial advantage during the 2026 tax year: the state does not impose a conventional individual state income tax on ordinary wages or NIL earnings.
According to the Washington Department of Revenue, a seven-figure athlete earning income in Washington can therefore avoid a state income-tax layer that a similarly compensated player might face in Oregon, California or New York, assuming the income is properly attributable to Washington and no additional state tax obligations arise.
However, avoiding a conventional state income tax does not mean an athlete keeps everything they earn. Federal income tax, Social Security, Medicare, self-employment taxes, other state sourcing obligations and potentially applicable business taxes can still reduce the amount of income a player ultimately retains.
Income type also matters. Some compensation may be treated as employee wages reported on a W-2, while independent NIL agreements may generate business income reported on a 1099. That distinction affects how employment taxes are calculated and why two athletes with similar gross earnings may have different after-tax outcomes.
For consistency across APSM’s roster valuations, the player illustration below uses the existing independent-NIL and self-employment benchmark rather than assuming knowledge of any athlete’s private combination of W-2 wages and 1099 compensation. Just as importantly, a player’s estimated market value does not establish that every dollar has actually been paid.
Washington also imposes a tax on certain long-term capital gains, meaning the state’s favorable treatment of ordinary NIL earnings does not extend to every form of income an athlete might receive.
Under the state’s tiered capital-gains framework, qualifying Washington taxable capital gains are generally subject to 7% on the first $1 million and 9.9% on amounts above that threshold, after applicable exemptions, deductions and other eligibility rules. These rates concern certain investment gains, not ordinary NIL earnings during the 2026 tax year.
A more significant change is already scheduled for the future. Beginning January 1, 2028, Washington’s newly enacted income-tax law is set to impose a 9.9% tax on Washington taxable income above a $1 million threshold, subject to statutory deductions, exclusions, credits and allocation rules.
As outlined by the Washington Department of Revenue, that law does not affect APSM’s 2026 player calculations or the standardized 2026 State Net Retention Score. It does, however, introduce a new financial consideration for athletes who may continue earning seven figures while establishing longer-term residency in Washington.
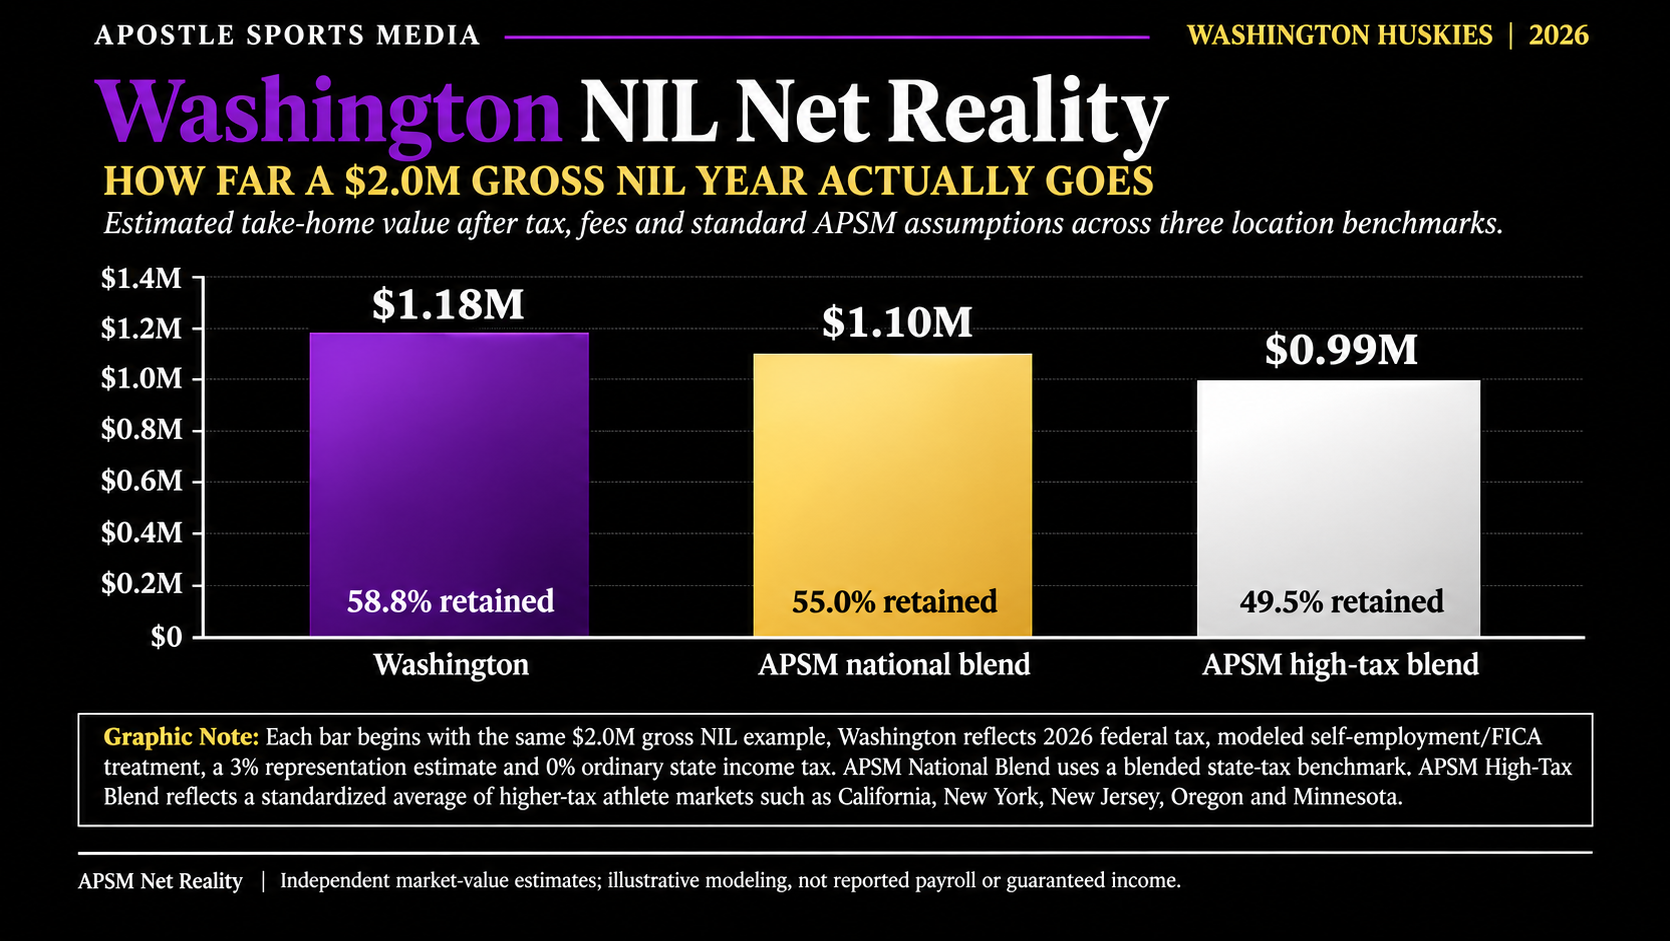
For the current 2026 model, APSM illustrates what this tax environment means using $2 million in gross NIL income, a 3% representation charge, no assumed personal expenses and Washington as the athlete’s primary state jurisdiction. After applying progressive federal and applicable self-employment tax assumptions, the illustrated athlete retains approximately $1,175,620, or 58.8% of gross income.
That leaves a difference of approximately $824,380 between the original $2 million and the capital remaining after modeled taxes and representation costs. Even in a state without individual income tax on 2026 NIL earnings, a substantial portion of an athlete’s income can disappear before they purchase a home, begin investing or make any major personal financial decisions.
And that is ultimately the distinction APSM is measuring: the amount an athlete earns is not necessarily the amount they can keep, invest or build long-term wealth from.
Washington’s tax environment provides an advantage, but it does not eliminate the financial obligations standing between a seven-figure valuation and actual retained capital.
Seattle Sales Tax
Washington may offer its players a significant advantage when they earn their NIL income, but living in Seattle comes with costs that can quickly reduce that advantage. For October through December 2026, Seattle’s combined sales-and-use tax rate is 10.55%, meaning major taxable purchases can become considerably more expensive than the original price suggests.
For a Husky earning six or seven figures, buying a car, furnishing an apartment or making other large purchases may seem relatively minor compared with the size of an NIL agreement. But, those expenses come after taxes and representation fees have already reduced the player’s earnings.
The financial advantage of earning money in Washington is real, but how much of that advantage an athlete preserves depends partly on what they choose to spend after receiving it.
Seattle Property Tax
For Washington athletes considering purchasing a home, the financial commitment extends well beyond the original purchase price. According to the King County Assessor, one Seattle levy district carries a 2026 property-tax rate of approximately $9.91 per $1,000 of assessed value, equivalent to roughly $9,908 annually on a $1 million assessed property.
That becomes important for athletes whose largest earning opportunities may arrive during only a few seasons of college football.
A player could earn enough NIL income to afford a down payment or even purchase a property outright, but maintaining that home creates expenses that continue long after the original agreement expires.
For a player like Demond Williams Jr., whose modeled market value reaches $4.5 million, purchasing property may be financially possible; but the more important question is whether that investment makes sense when a future opportunity, transfer, or income change could take the athlete elsewhere.
Seattle Cost of Living and Real Estate
Seattle also presents a different financial environment from many traditional college towns. In Zillow’s August 2026 housing data, the city’s average home value was approximately $833,192, with average monthly rent around $2,234. (it is brutal, this is where APSM started)
Those figures matter because Washington athletes are not simply competing in a major college-football conference; they are living in one of the country’s most expensive metropolitan markets. While Seattle’s corporate presence creates valuable NIL opportunities, the same market can require players to commit more of their earnings toward housing and everyday expenses.
For an established athlete earning substantial compensation, buying a home may offer long-term benefits. For a freshman, a transfer or a player preparing for the NFL, renting could preserve the flexibility to move without tying a large portion of their available capital to a property.
That is the broader financial trade-off facing Washington’s roster. Seattle can be an excellent place to earn NIL income, but that does not automatically make it an inexpensive place to build wealth.
What matters is how much of that income players retain, what they commit to their lifestyles and whether those decisions still make sense after their college careers end.
A player’s market valuation does not necessarily reveal how much money they actually take home. For Washington’s roster, individual contracts, filing statuses, income types, deductions and personal expenses are not all publicly available. Rather than inventing private financial details, APSM applies the same standardized 2026 NIL methodology to each player, allowing their estimated earnings and retained capital to be compared on a consistent basis.
The model uses 2026 progressive federal income-tax brackets, APSM’s existing 1099-style self-employment and Medicare treatment, Washington’s 0% conventional individual state income tax and a 3% representation charge calculated from gross value.
It assumes 0% in personalized career or living expenses, while treating representation fees as a cash outflow without automatically assigning a corresponding tax deduction.
Individual tax treatment may differ, and APSM’s separate $1 million State Net Retention Score excludes representation charges entirely.
Using $2 million in gross NIL income as the standard benchmark, APSM estimates an athlete would retain approximately 58.8% after modeled taxes and representation costs. However, that percentage cannot simply be applied to every player on the roster.
Federal income taxes are progressive, the Social Security portion of self-employment tax has an annual earnings cap, and each athlete’s modeled gross value is different. For that reason, APSM calculates every player’s Net Reality independently rather than applying one fixed retention rate across the roster.
For Washington’s five highest-valued players, approximately $8.325 million in combined estimated gross market value translates to $4,921,005 in illustrative retained capital, with the remaining $3,403,995 absorbed by modeled taxes and representation costs.
Williams alone accounts for approximately $2,604,118 in retained capital from his $4.5 million gross scenario, while the other four athletes retain different percentages based on their individual valuations.
That difference illustrates why Washington’s roster value and its players’ financial outcomes are two separate questions.
The university may have $8.325 million of estimated market value concentrated in five athletes, but APSM’s model suggests those same players would collectively control closer to $4.92 million after the applicable financial drag. These are standardized illustrations, not disclosed salaries, confirmed cash payments or predictions of any individual athlete’s tax return.
Washington 2026 Player Net Reality
APSM roster range: ~$23M–$26M | Working midpoint: ~$24.4M | $2M Washington reference: 58.8% retained
| Player | Gross Value | Modeled Deductions | Modeled Net Capital |
|---|---|---|---|
| Demond Williams Jr. | $4,500,000 | ~$1,895,882 | ~$2,604,118 |
| Jacob Lane | $1,130,000 | ~$451,498 | ~$678,502 |
| Drew Azzopardi | $1,110,000 | ~$442,926 | ~$667,074 |
| Christian Moss | $835,000 | ~$325,060 | ~$509,940 |
| Kodi Greene | $750,000 | ~$288,629 | ~$461,371 |
The standardized model intentionally does not guess whether a particular player spends $20,000 on business operations or $200,000 on training, transportation, travel and personal consumption.
Those questions belong in the APSM Net Income Calculator, where the reader can change the variables and examine how gross income becomes usable capital.
Actual take-home outcomes can differ when income is paid as W-2 wages, through independent 1099 arrangements or across states (jock tax), which is why the standardized illustration is a starting comparison rather than an individual tax estimate.
One of the biggest financial advantages Washington offers its athletes goes beyond earning seven figures in a state with no state income tax (for now).
For players fortunate enough to receive substantial NIL compensation early in their careers, there is an opportunity to begin building wealth before they ever sign a professional contract.
Under APSM’s progressive Net Reality model, Demond Williams Jr.’s $4.5 million gross valuation translates to approximately $2.604 million in illustrative retained capital.
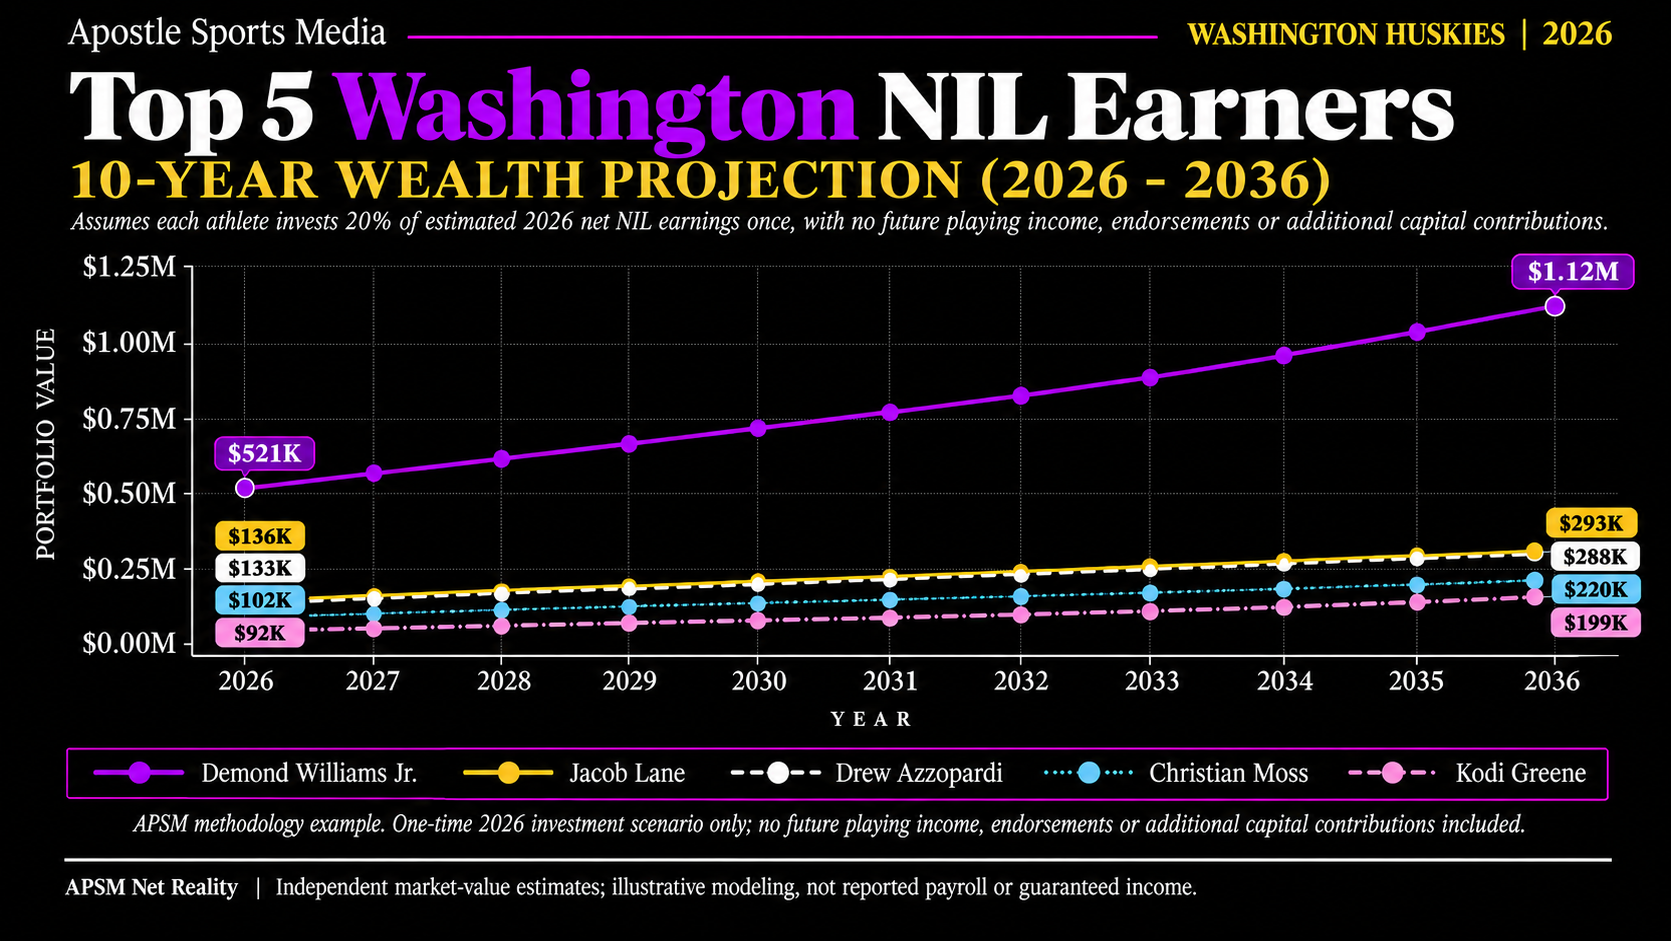
If Williams were to invest just 20% of that amount, or roughly $521,000 and leave it untouched for ten years at an illustrative 8% annual return, that one investment could grow to approximately $1.12 million by 2036.
This scenario does not require Williams to return to Washington next season, transfer, or even make another dollar playing football. The illustration assumes no future Washington payments, no NFL contract, no additional endorsement agreements and no new contributions to the investment.
Of course, Williams’ market valuation is not guaranteed cash compensation, and an 8% annual return is an assumption rather than a promise. Actual performance, taxes and fees could change the outcome considerably.
But the financial lesson remains: an athlete does not necessarily need a decade of million-dollar+ contracts to begin building long-term wealth.
One successful earning window, if the income is actually received and a portion is invested rather than spent, can create an opportunity that extends well beyond the player’s college career.
Seattle Real Estate: Ownership Versus Liquidity
For a player retaining several million dollars, buying a home in Seattle might seem like a natural next step. With the city’s average home value around $833,000, an athlete in Williams’ estimated financial position could potentially make a substantial down payment or even purchase a property without taking on a traditional mortgage.
But being able to afford a home does not automatically make buying one the best financial decision.
College football careers are relatively short, and a player who expects to enter the NFL, transfer schools or relocate within the next couple of years may find that homeownership creates more obligations than expected.
Property taxes, insurance, maintenance, closing costs and eventual selling expenses (capital gains) continue regardless of how much NIL income originally made the purchase possible.
For some athletes, renting in Seattle may preserve more flexibility, especially when their next career opportunity could require moving across the country. Others who intend to remain in Washington long term may find that purchasing a property makes sense as part of a broader investment strategy.
The important distinction is that having enough money to purchase an asset versus having a financial reason to own it.
A player could afford an expensive home while still being better served by keeping that capital available for investments, future expenses or opportunities that arise after football.
What One Season of Washington NIL Could Become by 2036
Williams is not the only Washington player whose estimated earnings could create a meaningful opportunity beyond college football. Applying the same investment scenario to APSM’s five highest-valued Huskies shows how even smaller NIL valuations can translate into substantial long-term capital.
The model assumes each athlete receives the equivalent of their estimated 2026 gross market value, pays the applicable modeled federal taxes and representation costs, and makes one investment equal to 20% of retained capital. That amount is then left invested for ten years at an illustrative 8% annual return, with no additional contributions.
Williams leads the group, investing approximately $521,000 and potentially reaching $1.124 million by 2036. Jacob Lane’s starting investment of roughly $136,000 could grow to approximately $293,000, while Drew Azzopardi’s $133,000 could become around $288,000.
Christian Moss, beginning with approximately $102,000, could reach $220,000 over the same period, while freshman Kodi Greene’s initial $92,000 investment could grow to roughly $199,000 by 2036.
Each player is given the same assumed return and investment period. The difference comes from how much capital each athlete could initially retain after taxes and representation, based on their individual gross valuations.
For Greene, who is only beginning his college career, it shows that a player does not necessarily need to become the highest-paid athlete on his roster to build a meaningful financial foundation. Even a smaller earning opportunity, when managed early, can provide years of potential investment growth before his playing career is over.
These scenarios do not include future NIL payments, professional contracts or additional investments, and the projected values are before any subsequent investment taxes and fees. They also do not represent predictions of the players’ eventual net worth.
The larger point is that Washington’s roster is worth an estimated $24.4 million today, but the long-term financial outcomes of its athletes will depend on much more than their current market prices.
How much income they actually receive, what remains after taxes and how they manage that capital could ultimately matter more than where they rank on APSM’s valuation list.
Washington’s new stadium agreement, the January contract dispute involving Demond Williams Jr. and the November win at Michigan State tell three different parts of the same financial story.
The university generates revenue through its brand and football program, invests in retaining the players it believes can help it compete, and ultimately sees the results of those decisions on Saturdays.
But those outcomes do not always move together. A win on the field does not automatically justify every dollar spent on the roster, just as a disappointing season does not mean the players have suddenly lost their market value.
The University of Washington is still operating a business with a bottom line, meaning commercial success, player compensation and football performance are connected, but they are not interchangeable.
The same distinction matters for the athletes themselves. A university can sign a major sponsorship agreement without directing all of that revenue toward player compensation. And an athlete can earn millions while ultimately retaining substantially less after federal taxes, applicable employment taxes and representation costs.
That is why the most important number in Washington’s financial picture is not necessarily the largest one. It is how much of an athlete’s earnings can eventually become durable, investable capital after gross market value is translated into actual compensation, financial obligations are paid and personal spending is accounted for.
Washington’s players have opportunities that previous generations of college athletes could only imagine, but those opportunities also come with financial decisions that can follow them long after their final game at Husky Stadium.
Temporary income can create lasting wealth, but the size of the original agreement alone will never determine whether it does.
Washington’s lack of a conventional state income tax gives its athletes a financial advantage that players in many other college markets do not have. But even without that additional tax burden, a seven-figure NIL agreement does not mean an athlete gets to keep seven figures.
Under APSM’s standardized $1 million, tax-only 2026 benchmark, Washington earns a Net Retention Score of 63/100.
The model applies 2026 progressive federal income taxes and standardized self-employment taxes, while Washington’s conventional individual income-tax rate remains at zero. With no representation fees or career expenses included, an athlete earning $1 million would retain approximately $634,220 in modeled capital, or 63.4% of gross income.
That result becomes more interesting when compared with Washington’s higher-valued players. At the separate $2 million NIL benchmark, APSM estimates an athlete retains approximately 58.8%, while Demond Williams Jr.’s $4.5 million scenario produces roughly 57.9% retained capital.
The difference does not mean Washington suddenly becomes a less favorable state as a player earns more. Federal income taxes are progressive, and the individual player models also include a 3% representation charge that the standardized state score intentionally excludes.
By keeping the $1 million benchmark consistent across every state, APSM can compare the effects of different tax environments without assuming what each athlete pays an agent or spends personally.
There is also an important timeline distinction. Washington’s 63/100 score reflects the 2026 tax year, not the state’s newly enacted high-income tax scheduled to begin in 2028. An athlete considering a long-term residency decision extending beyond 2027 should account for that future change separately rather than applying it to earnings from the current season.
For Husky players, the takeaway is that Washington state provides a meaningful advantage when NIL income is earned, but keeping that advantage still depends on how the athlete manages the money afterward.
A favorable tax environment creates more room to build wealth; it does not guarantee that the wealth will last.
For Athletes
For Washington’s players, the opportunity to earn substantial NIL income while competing in Seattle is something previous generations of Huskies never had. The state’s favorable 2026 income-tax environment and access to major corporate sponsors give athletes an advantage, but neither guarantees that a seven-figure valuation will translate into lasting financial security.
A player like Demond Williams Jr. may command millions in estimated market value, but what matters personally is how much compensation he actually receives, whether that income is reported as W-2 wages or independent 1099 earnings, and what remains after taxes, representation fees and expenses.
Seattle can be an excellent place to earn money and an expensive place to spend it. The players who benefit most from this earning window may ultimately be those who turn part of their retained income into investments and other productive assets rather than permanent lifestyle obligations.
For Agents
The Williams contract dispute demonstrated how much college athlete representation has changed. An agent is no longer simply negotiating appearances or helping a player evaluate which school offers the most money.
These agreements can now involve direct institutional compensation, third-party NIL opportunities, transfer decisions and contractual obligations that extend beyond the football field.
For an athlete whose market value can change significantly in a single season, understanding payment schedules, guaranteed compensation and the consequences of leaving a program can be just as important as negotiating the original headline figure.
The responsibility is not simply to secure the largest agreement available, but to help the athlete understand what that agreement actually guarantees, what obligations come with it and how much income remains after taxes and fees.
For Sponsors
Washington offers sponsors something many college programs cannot replicate: a recognizable Big Ten football brand operating in one of the country’s largest corporate markets.
Companies can build relationships with the university through traditional athletic sponsorships, licensed media, institutional marketing campaigns and separate NIL agreements with individual players.
Programs such as Dawgs Unleashed and Sundodger Studios have expanded Washington’s ability to connect athletes, advertisers and audiences through commercial content. But having access to a major college-football market does not automatically make every sponsorship a profitable investment.
For companies spending money around the Huskies, the question is whether those partnerships generate meaningful exposure, customer engagement and measurable business results.
Washington’s reported $70 million stadium agreement and a player’s individual NIL deal may both benefit from the same audience, but they represent different investments with different commercial objectives.
For Washington
For the university, the challenge is turning an increasingly expensive football operation into sustained success on the field without neglecting the rest of its athletic department.
Washington must compensate its coaches, support 22 varsity programs, maintain facilities and compete financially with the Big Ten’s largest brands, all while developing athletes whose market values may rise faster than the university originally anticipated.
That is what makes the Huskies’ retention-heavy approach both promising and expensive. Developing players internally can help Washington preserve continuity and avoid rebuilding through the portal every offseason, but keeping those players becomes a different financial decision once their market values increase.
The Columbia Bank partnership provides another long-term commercial revenue opportunity, but generating more money does not eliminate the need to decide where that money is best spent.
Washington must determine how much value it can reasonably concentrate in a quarterback like Williams while maintaining the offensive line, defense and depth necessary to compete across an entire Big Ten season.
Ultimately, the university’s financial success will depend on more than the size of its sponsorship agreements or estimated roster valuation. It will depend on whether the Huskies can turn those investments into a competitive football program while maintaining the flexibility to sustain it.
APSM estimates Washington’s 2026 football roster at roughly $23 million – $26 million, with a $24.4 million working midpoint. Roughly 76% of that value belongs to retained athletes, while Demond Williams Jr. alone accounts for approximately $4.5 million, or 18.4% of the entire roster.
The Huskies’ five highest-valued players combine for $8.325 million in estimated market value, representing 34.1% of Washington’s roster. Under APSM’s standardized progressive Net Reality model, that same amount would translate to approximately $4.92 million in retained capital if the modeled income were actually received.
But Washington’s financial story extends well beyond its players. The university generated approximately $178.47 million in FY2025 athletic-department revenue, reported roughly $121.02 million in football revenue under the separate EADA framework, and has now secured a stadium naming-rights agreement reportedly worth $70 million over ten years.
Despite that commercial growth, the Huskies are still trying to return to the level of football they reached under Kalen DeBoer.
Jedd Fisch is managing an increasingly expensive roster, Williams remains a multimillion-dollar investment, and retaining developed talent has become a financial negotiation almost as important as recruiting it.
For the athletes, Washington’s 63/100 Net Retention Score provides a favorable 2026 tax starting point, but Seattle’s expensive housing market and the costs of maintaining a lifestyle can quickly reduce that advantage.
Williams’ $4.5 million market valuation, for example, produces approximately $2.604 million in illustrative retained capital under APSM’s model. Investing 20% of that amount once, at an illustrative 8% annual return, could grow to approximately $1.124 million by 2036, without another dollar of football income.
And that is ultimately what makes Washington’s situation so interesting. The university can sell the naming rights to Husky Stadium, commit millions to retaining its quarterback and generate substantial revenue around its football program, but none of those transactions guarantees success on Saturdays or lasting wealth for the athletes.
Washington is building a more valuable football business, but its players still have to build their own financial futures. What they earn during these few seasons matters, but what they manage to keep and turn into lasting assets may matter considerably more.
That is the Net Reality.
What is Washington football’s 2026 roster worth?
APSM estimates Washington’s 2026 football roster at $23 million–$26 million, with a $24.4 million working midpoint. This represents estimated open-market player value, not a disclosed university payroll.
Who are the Washington Huskies’ five highest-valued football players in 2026?
- Demond Williams Jr. ($4.5M; 18.4%)
- Jacob Lane ($1.13M; 4.6%)
- Drew Azzopardi ($1.11M; 4.5%)
- Christian Moss ($835K; 3.4%)
- Kodi Greene ($750K; 3.1%)
Together, they represent approximately $8.325 million, or 34.1% of APSM’s $24.4 million roster midpoint.
Is Washington actually paying its football roster $23 million-$26 million?
Not necessarily. APSM’s estimate measures player market value, not verified university compensation. Washington’s institutional revenue sharing, independent third-party NIL payments, coaching salaries and athletic-department expenses are separate financial categories. The approximately $21.5 million 2026-27 institutional revenue-sharing cap applies schoolwide, not exclusively to football.
How much does a Washington athlete keep from $2 million in NIL income?
Under APSM’s standardized 2026 independent-NIL model, an athlete earning $2 million gross would retain approximately $1,175,620, or 58.8%, after progressive federal taxes, applicable self-employment taxes and a 3% representation fee. Actual results depend on income classification, deductions, residency and individual agreements.
Does Washington have a state income tax for NIL athletes in 2026?
Washington imposes no conventional individual state income tax on ordinary NIL earnings in 2026, although federal and applicable employment taxes still apply. APSM gives Washington a 63/100 tax-only Net Retention Score. A separate 9.9% state tax on qualifying income above $1 million is scheduled to begin in 2028 and does not affect the 2026 estimates.
- College Football Has Entered Its Contract Era: The Financial Fallout of the Demond Williams Jr. Case
- Ole Miss 2026 CFB Roster Valuation: Net Reality
- Ohio State 2026 CFB Roster Valuation: Net Reality
- Georgia 2026 CFB Roster Valuation: Net Reality
- Washington State Athlete Taxes
Sources & Methodology
APSM’s Washington roster valuation is an independent estimate developed from public player valuations, reported compensation agreements, official university records, NCAA and federal athletic-finance disclosures, and its own player-level modeling.
APSM does not treat third-party valuations as verified compensation or combine player market value with institutional revenue-sharing allocations to manufacture a university payroll figure.
- Roster, player development and contract reporting: Washington Athletics’ official football roster, Big Ten Media Days reporting, NCAA transfer research, NIL Standard’s Washington roster estimates, Reuters’ Demond Williams contract reporting, Sports Business Journal and Washington’s November football reporting.
- Institutional finances, revenue sharing and commercial partnerships: Washington’s House-settlement announcement, College Sports Commission, Knight-Newhouse financial data, NCAA and EADA financial disclosures, Columbia Bank stadium partnership, On Montlake’s agreement reporting, Dawgs Unleashed, Learfield, and Sundodger Studios.
- Federal taxation, Washington taxes and Seattle housing: IRS 2026 federal tax parameters, Social Security Administration’s 2026 contribution limits, Washington Department of Revenue, Washington capital-gains tax rates, Seattle sales-tax schedules, King County property-tax reports and Zillow’s Seattle housing data.
APSM valuation and Net Reality methodology: The $24.4 million working midpoint, estimated 76% retained / 17% transfer / 7% recruit allocation and individual player valuations are APSM estimates, not disclosures of private university agreements.
APSM uses the Net Income Calculator and its Net Reality methodology to model 2026 progressive federal taxation, standardized 1099-style self-employment treatment, Washington’s ordinary state income-tax environment, a 3% gross representation charge and zero assumed personal expenses.
Each player’s gross valuation is calculated independently rather than multiplied by a fixed retention percentage. The standardized $1 million State Net Retention Score excludes representation fees, while the separate $2 million benchmark and top-five player illustrations include them. The ten-year investment scenario allocates 20% of modeled retained capital once, assumes an illustrative 8% annual return and excludes future contributions, investment taxes and fees.
All figures are educational estimates rather than disclosed player salaries, individualized tax outcomes or guaranteed investment returns.
Disclaimer: This article contains general financial information for educational purposes and does not constitute legal, tax or investment advice. APSM estimates are based on publicly available information, analytical modeling and disclosed assumptions. Actual athlete earnings and tax outcomes depend on private agreements, payment timing, employment classification, residency, income sourcing, federal and state law, filing status, deductions, benefits, agent contracts and personal financial decisions. Market valuations, projected returns and illustrative retained capital are not guarantees of compensation, after-tax wealth or investment performance.