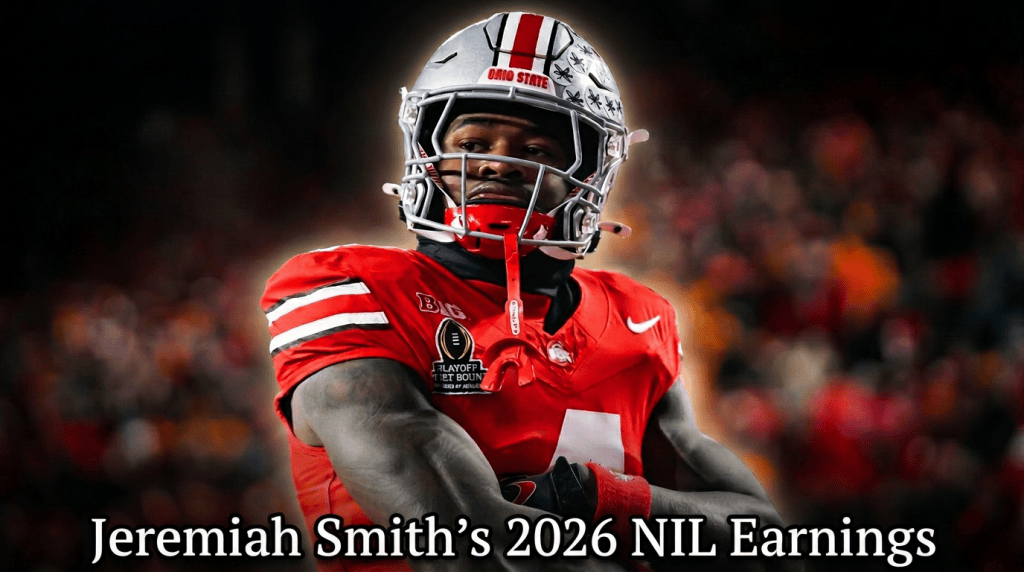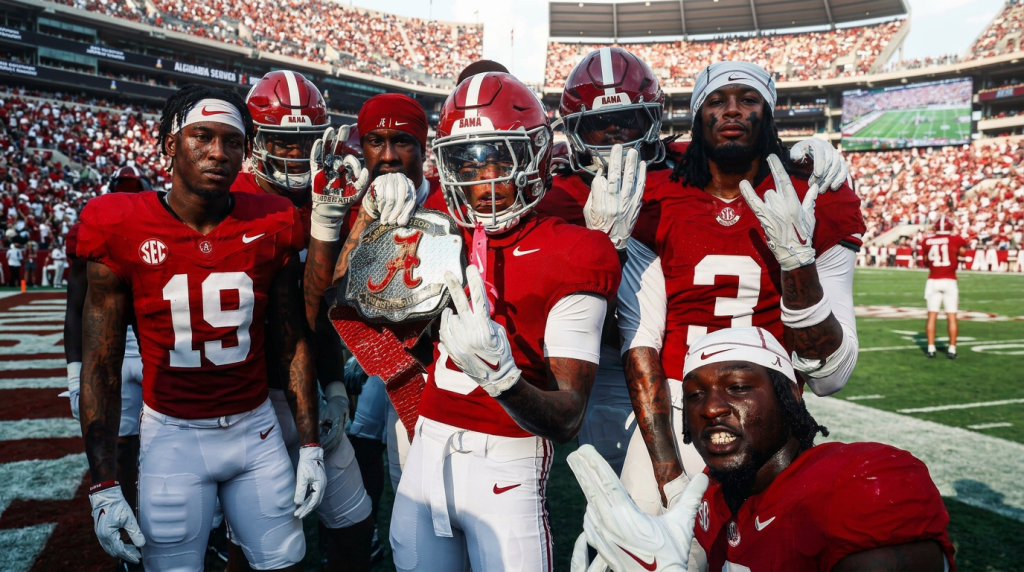

Ohio State beat Notre Dame 34-23 on January 20, 2025, at Mercedes-Benz Stadium in Atlanta, claiming the program’s ninth national championship and its second in the College Football Playoff era.
Ryan Day finally got his ring. Jeremiah Smith made the play everyone saw coming. And 22.1 million viewers watched it happen, making it the most-watched non-NFL sporting event of the past year.
But this isn’t a recap. You know the score.
What most coverage missed, and what almost nobody broke down afterward, is what this championship actually meant financially, for the programs, for the players, for the first 12-team CFP format that just completed its inaugural run, and for the college football economy that both Ohio State and Notre Dame sit at the very top of.
That’s what this is.
2024-25 College Football Playoff Cumulative Payout Architecture
| Tournament Round Reached | Base Performance Payout | Travel Expense Subsidy (Per Round) | Revenue Retention Protocol (Ohio State) | Revenue Retention Protocol (Notre Dame) |
| First Round / Bracket Entry | $4,000,000 | $3,000,000 | Subject to Equal Big Ten Roster Pooling | 100% Direct Retention |
| Quarterfinal Advancement | +$4,000,000 | +$3,000,000 | Subject to Equal Big Ten Roster Pooling | 100% Direct Retention |
| Semifinal Advancement | +$6,000,000 | +$3,000,000 | Subject to Equal Big Ten Roster Pooling | 100% Direct Retention |
| National Championship | +$6,000,000 | +$3,000,000 | Subject to Equal Big Ten Roster Pooling | 100% Direct Retention |
| Maximum Total Gross Asset | $20,000,000 | $12,000,000 | Pooled Allocation: Distributed among 18 members | Independent Allocation: $25.49M retained |
Under the inaugural 12-team layout, the maximum base performance pool per team topped out at $20,000,000. However, the true variance lies in the backend distribution bylaws.
While Ohio State’s historic run generated substantial revenue, the Big Ten’s mandatory revenue-sharing model meant the check was split evenly among all 18 member institutions.
Conversely, Notre Dame exploited its independent status to retain its entire payout directly alongside a baseline $5.49 million APR retention check, highlighting the immense value of independent brand equity in the modern era.
The Game’s Financial Context: The First 12-Team CFP Era
The 2024-25 season was the first under the expanded 12-team College Football Playoff format, a structural change that fundamentally altered how college football’s postseason money works.
More teams in the bracket meant more games, more media inventory, more gate revenue, and more payout distribution across more programs and conferences (rather than just the Power 4).
For context on what the expanded format produced:
- 77,660 fans attended the national championship game in Atlanta, the highest attendance at a CFP title game since 2015
- 22.1 million viewers watched Ohio State’s victory on ESPN, making it the most-watched non-NFL sporting event of the past year, peaking at 26.1 million during the second quarter
- Average ticket prices across the quarterfinals, semifinals, and national championship increased by 8% compared to the prior season, with title game average prices more than 35% higher than the 2023 championship
The viewership represented a 12% decline from the 25 million who watched Michigan beat Washington in the 2024 championship, but context matters, because the game aired the same night as President Trump’s inauguration, which drew competing media attention and eyes.
ESPN is now in just ~65 million homes, down from more than 90 million homes when Ohio State won its previous championship in 2015, meaning the 2025 Buckeyes title win saw an average viewership of ~22.1 million viewers, a structurally different number than the 34.1 million viewers that OSU had in the same slot a decade earlier.
Decoding the 12-Team Financial Engine
The expansion to a 12-team bracket did far more than add games to the postseason schedule; it systematically overhauled the entire postseason financial model. Under the previous four-team format, postseason distributions were concentrated among a small handful of elite programs.
The expanded system transformed the playoff into an extensive media inventory engine, generating significant new revenue via corporate sponsorships and ticket packages. A core driver of this financial transformation is the CFP’s massive media rights agreement with ESPN, valued at an average of $1.3 billion annually.
The inventory expansion provided the capital needed to support a tiered, round-by-round incentive structure:
- The Baseline Entry Fee: Merely securing a seed in the 12-team field locked in a $4 million base payout for a program’s respective conference or institutional pool.
- The Quarterfinal Escalation: Advancing past the opening round added another $4 million to the ledger.
- The Semifinal and Championship Premiums: Reaching the final four and the national title game triggered consecutive $6 million payouts, bringing the maximum base performance payout to $20 million for the two final teams.
Beyond raw performance payouts, the expanded structure introduced a critical hidden revenue layer: the $3 million per-round travel and operational expense allowance.
For programs advancing all the way from the first round to the national final, this allowance added up to $12 million in liquid capital intended to offset the cost of travel and other accommodations.
The Distribution Divide: Conference Pooling vs. Absolute Independence
While both Ohio State and Notre Dame generated equal base earnings on their march to Atlanta, the corporate structures governing how that money was retained could not be more distinct. This variance highlights one of the most compelling strategic debates in modern college sports business.
The Big Ten’s Socialism Model
Ohio State operates as a member of the Big Ten Conference, which commands one of the most lucrative media rights packages in the world, generating over $1 billion annually across partnerships with Fox, CBS, and NBC. However, the conference enforces a strict equal-revenue-sharing policy for all postseason earnings.
The $20 million earned by the Buckeyes did not go directly into the Columbus athletic department’s accounts. Instead, it was funneled into the central conference pool to be split equally among all 18 member schools.
While this model provides financial stability for the entire conference, it means flagship programs carry a disproportionate amount of the operational risk required to generate those postseason returns.
Notre Dame’s Independence Premium
Notre Dame has consistently protected its independent status in football, resisting the wave of modern conference realignment. The payout structure for the national championship game demonstrates why.
As an independent, the Fighting Irish do not answer to a conference commissioner or share revenue with peer institutions. The school kept its entire multi-million dollar performance payout, supplemented by an individual $5.49 million Academic Progress Rate (APR) baseline payout.
Supported by an exclusive home broadcast partnership with NBC Sports, Notre Dame’s ability to maintain its independence allows the athletic department to operate with a lean, highly efficient corporate structure that keeps its revenue entirely in-house.
The Real Math of Championship NIL Portfolios
The matchup also highlighted the immense scale of modern NIL ecosystems. The game was won and lost as much by collective fundraising and corporate matching pipelines as it was by on-field schemes.
[Ohio State Football NIL Collective Budget Expansion]
2023-24 Season: $13 Million
└───► 54% Single-Offseason Increase
2024-25 Season: $20 Million (Highly targeted elite roster retention)
Ohio State’s football collective operated with an estimated budget approaching $20 million, marking a 54% increase over the previous year. This aggressive capital deployment transformed the roster into a highly efficient executive lineup:
- Jeremiah Smith’s Corporate Footprint: The standout freshman wide receiver built an NIL portfolio valued at an estimated $3.7 million. Backed by major national brands like Red Bull, Nintendo, and Epic Games alongside regional real estate and automotive partnerships, Smith’s brand value mirrored that of an elite NFL draft prospect.
- Will Howard’s Market Shift: The graduate transfer quarterback provided a clear example of the transfer portal’s financial potential. His baseline valuation rose to over $7 million after he stepped into the starting role for the Buckeyes, proving that pairing the right talent with a top-tier media market can instantly optimize a player’s earning power.
Notre Dame approached the market with a different strategy, leaning heavily on the organic marketing power of the university’s individual brand. While their collective budget didn’t match the scale of Ohio State’s, starting quarterback Riley Leonard still built a robust $2 million valuation.
The high visibility of playing quarterback for the Fighting Irish on national television served as a natural value multiplier, attracting premium corporate partnerships without requiring massive upfront outlays from donor collectives.
The Bottom Line
- Maximum base postseason contract value per program: $20,000,000.
- Total cumulative round-by-round travel subsidies: $12,000,000.
Analyzing the financial architecture of the national championship game proves that modern college athletics has evolved far beyond traditional collegiate models. The postseason is now a highly commercialized entertainment product designed to maximize media rights values and corporate partnerships.
As the playoff structure continues to evolve, the gap between programs backed by massive, donor-funded collectives and those relying on independent brand equity will define the future of sports business.
Success in this new landscape requires sophisticated roster construction, precise tax and asset planning, and a deep understanding of how revenue moves through the system.
CFP Revenue & Roster Valuation FAQs
How does conference revenue sharing impact a team’s total payout from a College Football Playoff run?
Postseason revenue retention depends entirely on conference bylaws. In a shared-revenue conference like the Big Ten, all performance payouts earned by a member school are pooled centrally and divided equally among all institutions in the conference. In contrast, an independent program like Notre Dame retains 100% of its playoff earnings directly, avoiding any mandatory revenue-sharing obligations with peer schools.
What is the structural role of the CFP’s per-round travel and operational expense allowance?
The CFP provides a fixed $3 million per-round expense allowance to every participating institution. This capital is designed to cover the significant logistical costs of moving football teams, support staff, athletic executives, and marching bands over a multi-week tournament. For teams that advance all the way to the national final, this structure injects millions in liquid capital directly into the athletic department’s operational budget.
Why does a high-profile media market like Ohio State accelerate a player’s individual NIL valuation?
NIL valuations are driven by a combination of on-field production, individual social media reach, and the size of the university’s media market. A flagship program with a massive, highly engaged fan base and strong corporate relationships can connect its athletes with top-tier national brands far more effectively than smaller regional programs, functioning much like a professional sports agency pipeline.
Next Reads
- Heisman Winner and Raiders #1 2026 NFL Draft Pick Fernando Mendoza Should Leave Indiana In the Past and Anchor In Nevada: Rookie Taxes, Real Estate, and Residency Analysis
- 2026 NFL Draft: Every 1st Round Contract Details, Net Income & Residency Analysis
- Cam Ward’s Rookie Contract with the Tennessee Titans
- Travis Hunter’s Draft Night Tax Audit: The Real Value of His Potential Rookie Landing Spots
- Luther Burden III’s Fully Guaranteed NFL Rookie Contract
Disclaimer: This article contains general financial information for educational purposes and does not constitute professional advice. APSM estimates are derived from publicly available information, tax assumptions, finance modeling, and industry-standard fee structures. Actual earnings may vary based on residency elections, private contract provisions, image/media rights agreements, bonuses, and tax filings.