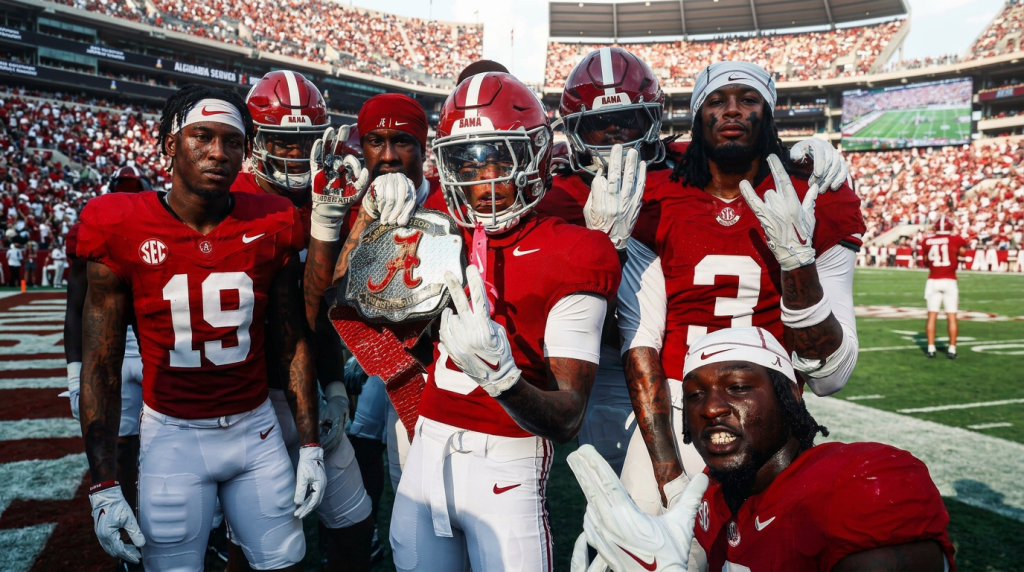

The Fiesta Bowl held the CFP Semifinal matchup between Miami and Ole Miss, and it lived up to the moment. No. 10 Miami outlasted No. 6 Ole Miss 31-27 on January 8, 2026, capped by Carson Beck’s game-winning 3-yard scramble with just 18 seconds left on the clock, sending the Hurricanes to the CFP National Championship.
The matchup was a genuine thriller and was a much more competitive game than Indiana vs Oregon in the Peach Bowl. It was also a multi-layered revenue event that reinforces how much money actually moves through a single college football playoff game.
Fiesta Bowl Financial Snapshot
| Metric | Figure | What It Means |
|---|---|---|
| Attendance | 67,928 | Packed lower and upper bowls, maximizing concessions and merchandise revenue |
| Broadcast Reach | ESPN prime-time national window | Top-tier ad revenue generation for the network |
| Estimated Local Economic Impact | $30M-$45M | Direct injection into Maricopa County hospitality, lodging, and transport |
| Winning Program Payout | ~$17M via ACC distribution | Feeds athletic department budgets and the ongoing facilities arms race |
College Football Playoff Revenue Distribution
Unlike traditional bowl games that set their own individual payouts, CFP revenue flows through a centralized model. Teams earn prize money for reaching each stage of the playoff, and that money is paid largely to their conferences, then allocated according to each conference’s own bylaws.
CFP Payout Breakdown
- $4M for making the CFP field
- $4M for winning the quarterfinal
- $6M for reaching the CFP semifinal (Fiesta Bowl)
- +$3M per round in travel and expense stipends
Total tied to Fiesta Bowl semifinal appearance: approximately $17 million per team for their conferences by kickoff, not including later rounds or championship allocation.
That means Miami generated ~$17 million in CFP revenue for the ACC, and Ole Miss generated ~$17 million for the SEC. How that money actually lands for the teams, universities, staff and athletes though, depends heavily on the conference rules in place.
Miami’s ACC model lets the program retain much more of its own earnings directly. Ole Miss’s SEC revenue gets pooled and shared more broadly across the conference, meaning a single school’s playoff run subsidizes facilities and budgets at schools who never made the field.
The Glendale Economic Engine
With the books closed on the January 8 semifinal, the financial reality lines up with the on-field chaos. The 67,928 fans who packed State Farm Stadium in Glendale, Arizona drove tens of millions in local hospitality, tourism, and direct economic output into the greater Phoenix metro area.
Matchups like this one, a lower-seeded darling in Ole Miss against a historic brand like “The U,” are exactly what drive premium ticket demand, sponsor activation, and media rights value to their peak.
A CFP semifinal at this level functions less like a college football game and more like a corporate merger, converting 60 minutes of on-field output into a genuine commercial windfall, for essentially everyone involved except the players actually generating it.
Estimated Ticket Sales & Gate Revenue
State Farm Stadium seats ~63,000, though the reported 67,928 figure reflects standing-room and non-seat access typical of a high-demand CFP semifinal. It’s unlikely a single ticket in the building sold for less than $200, with premium seating likely in the $500 to $1,000-plus range.
Using standard industry estimates against confirmed attendance, gate receipts for the Fiesta Bowl likely landed in the $15-$20 million-plus range.
That gross revenue splits between the hosting bowl organization and its partners before flowing back into the broader CFP system, funding future bowl payouts and travel expense offsets. Exact figures aren’t publicly released, but these ranges reflect how major CFP bowls consistently perform financially.
Sponsorship, Broadcast & Advertising Revenue
CFP semifinals broadcast under ESPN’s media rights deal, worth hundreds of millions annually across the full slate of games. While the exact per-game revenue split isn’t public, semifinal games like this one consistently draw national audiences in the double-digit millions, which drives media rights value, corporate sponsorship pricing, in-game advertising premiums, and merchandise licensing all at once. Past CFP semifinals have pulled 13 million-plus viewers, translating to tens of millions in advertising and network value for a single broadcast window.
Merchandising & NIL Exposure
Hard to quantify precisely without internal licensing data, but CFP success reliably drives official bowl merchandise sales, a real spike in NIL opportunities tied to the sponsorship attention that follows a deep playoff run, and social campaign monetization as brands pay to be associated with the moment. Given the national attention this specific game drew, this segment likely brought several million more dollars into the ecosystem for both universities and their affiliated NIL collectives.
What This Means for the Programs Involved
Miami
The Hurricanes kept the larger share of its CFP earnings under the ACC’s model, with no conference-wide funding pool requirement the way Ole Miss faced in the SEC. Beyond the direct payout, the exposure value alone, College GameDay, national primetime slots, a run to the championship, is worth real money in recruiting and donor engagement that never shows up on a single line item.
Ole Miss
Generated tens of millions for the SEC and NCAA and still carried strong financial incentives even in the loss. SEC revenue-sharing pools assist with future scheduling, facilities, and athletic department budgets across the conference, meaning any team that generates significant postseason revenue is required to funnel a portion of it back into that shared pool.
The NCAA and CFP
Collect their own return through media rights, a share of gate proceeds, venue and merchandise revenue, and the broader financial ecosystem every participating program feeds into. Semifinal games like this one remain among the most valuable individual sporting events in U.S. sports economics.
The Rest of the Story
Miami’s Fiesta Bowl win sent the Hurricanes to the CFP National Championship at Hard Rock Stadium, their own home venue, against a previously winless-program-turned-undefeated Indiana squad. Indiana won 27-21 on January 19, completing a perfect 16-0 season and claiming the program’s first national title in its history.
The financial upside from the Fiesta Bowl run for Miami didn’t disappear with that loss, the CFP payout, the exposure, and the NIL attention were already locked in the moment they beat Ole Miss.
But, it’s a real reminder that postseason revenue and postseason outcomes are two separate financial stories, one guaranteed the moment you qualify, the other determined on the field.
Why This Matters, If You’re the One Playing
Here’s the takeaway that matters most if you’re a college athlete reading this rather than just a fan. You are the actual engine driving events like the Fiesta Bowl. Universities, conferences, and broadcast partners are the ones cashing the checks generated by your performance on that field.
Understanding that system isn’t cynicism, it’s just financial literacy. Make sure your own personal brand, your NIL value, and whatever equity or ownership positioning is available to you are actually capturing a fair share of the value you’re personally creating.
Remember, the system around you is built to monetize your effort and generate as much revenue as possible from your talent during your time at a university in this era, whether or not you’re doing the same for yourself.
Bottom Line
The Fiesta Bowl wasn’t just a dramatic playoff game decided by a 3-yard scramble with 18 seconds on the clock.
It was a multi-layered revenue event, roughly $17 million in guaranteed CFP payout per conference, $15-20 million in gate revenue, tens of millions in broadcast and sponsorship value, and $30-45 million in regional economic impact, all generated by just 60 total minutes of football.
College football’s postseason continues to be one of the most lucrative ecosystems in American sports, and CFP semifinals like this one are exactly where that money gets made.
2026 Fiesta Bowl Revenue FAQs
What was the final score of the 2026 CFP Fiesta Bowl?
No. 10 Miami defeated No. 6 Ole Miss 31-27 in a semifinal thriller on January 8, 2026, with Carson Beck scrambling in the game-winning touchdown from 3 yards out with 18 seconds remaining.
How much CFP revenue did Miami and Ole Miss generate from the Fiesta Bowl?
Each team generated approximately $17 million for their respective conference through the CFP’s centralized payout model, covering the field-entry payout, quarterfinal win, and semifinal appearance. Miami’s ACC model let the program retain more of that revenue directly, while Ole Miss’s SEC earnings are pooled more broadly across the conference.
How much money did the Fiesta Bowl contribute in revenue to Arizona’s local economy?
Estimates place the direct economic impact between $30 million and $45 million for the greater Phoenix metro area, driven by hotel stays, restaurant spending, transportation, and tourism tied to the 67,928 fans in attendance.
What happened to Miami after winning the Fiesta Bowl?
The win sent Miami to the CFP National Championship at Hard Rock Stadium, where the Hurricanes lost 27-21 to an undefeated Indiana team on January 19, 2026. Indiana finished 16-0 and claimed the program’s first national championship in its history.
Next Reads
- Oregon vs Indiana Peach Bowl Projected Gate Revenue: Tickets, Attendance & Economic Impact
- What NCAA’s New Betting Rules Mean for Future Gambling Revenue
- Lane Kiffin Could Earn $1 Million Off Ole Miss’s CFP Run After Leaving for LSU: Inside the Head Coach Postseason Bonus Structure
- 2025 CFP Championship: What Ohio State’s Title Was Actually Worth
- Miami is a Financial Gold Mine for Dolphins #12 Pick Kadyn Proctor: 2026 NFL Draft Rookie Real Estate & Residency Analysis
Disclaimer: This article contains general financial information for educational purposes and does not constitute professional advice. APSM estimates are derived from publicly available information, tax assumptions, finance modeling, and industry-standard fee structures. Actual earnings may vary based on residency elections, private contract provisions, image/media rights agreements, bonuses, and tax filings.